Skip Navigation
Skip to contents

Cancer Res Treat : Cancer Research and Treatment

OPEN ACCESS

Articles

Page Path
HOME > Cancer Res Treat > Volume 48(3); 2016 > Article
Original Article The Overexpression of CCAR1 in Hepatocellular Carcinoma Associates with Poor Prognosis
Sang Yun Ha, MD, PhD1, Jeong Hoon Kim, PhD2, Jung Wook Yang, MD1, Jimin Kim, MD1, Binnari Kim, MD1, Cheol-Keun Park, MD, PhD1,
Cancer Research and Treatment : Official Journal of Korean Cancer Association 2016;48(3):1065-1073.
DOI: https://doi.org/10.4143/crt.2015.302
Published online: October 16, 2015

1Department of Pathology, Samsung Medical Center, Sungkyunkwan University School of Medicine, Seoul, Korea

2Department of Molecular Biology, Samsung Advanced Institute for Health Science and Technology, Sungkyunkwan University School of Medicine, Seoul, Korea

Correspondence: Cheol-Keun Park, MD, PhD  Department of Pathology, Samsung Medical Center, Sungkyunkwan University School of Medicine, 81 Irwon-ro, Gangnam-gu, Seoul 06351, Korea 
Tel: 82-2-3410-2766 Fax: 82-2-3410-0025 E-mail: ckpark@skku.edu
• Received: August 11, 2015   • Accepted: October 6, 2015

Copyright © 2016 by the Korean Cancer Association

This is an Open Access article distributed under the terms of the Creative Commons Attribution Non-Commercial License (http://creativecommons.org/licenses/by-nc/3.0/) which permits unrestricted non-commercial use, distribution, and reproduction in any medium, provided the original work is properly cited.

  • 29,089 Views
  • 155 Download
  • 14 Web of Science
  • 10 Crossref
  • 14 Scopus
prev next
  • Purpose
    Cell division cycle and apoptosis regulator 1 (CCAR1) plays a dynamic role in regulation of cell growth and apoptosis by serving as a cofactor of steroid/thyroid nuclear receptors, β-catenin, and p53 in a variety of cell types including different cancer cells. However, whether CCAR1 protein is overexpressed in hepatocellular carcinoma (HCC) and the prognostic significance of CCAR1 protein expression in HCC have not been reported.
  • Materials and Methods
    In 167 HCC patients with long-term follow-up, CCAR1 protein expression was examined by immunohistochemistry.
  • Results
    High CCAR1 protein expression was observed in 149 of the 167 HCC cases (89.2%) and showed significant correlation with microvascular invasion, intrahepatic metastasis, higher American Joint Committee on Cancer (AJCC) T stage, and early recurrence. High CCAR1 expression showed an unfavorable effect on recurrence-free survival (RFS) (p=0.002). In subgroup analysis, among patients with α-fetoprotein ≤ 20 ng/mL (n=54) and patients with AJCC T stage 1 (n=62), significant differences in RFS were observed between high CCAR1 expression groups and low CCAR1 expression groups (p=0.015 and p=0.004, respectively). High CCAR1 expression tended to be an independent predictor of shorter RFS (p=0.054) and showed an unfavorable effect on overall survival (OS) (p=0.015). In subgroup analysis, among patients with α-fetoprotein ≤ 20 ng/mL (n=54), significant difference in OS was observed between high CCAR1 expression group and low CCAR1 expression group (p=0.046).
  • Conclusion
    CCAR1 protein could be a potential biomarker predicting RFS in HCC patients after curative hepatectomy. In addition, CCAR1 had prognostic values in HCC patients with normal serum α-fetoprotein levels or early stage HCC.
In spite of improvements in surveillance and clinical treatment strategies, the overall survival (OS) of hepatocellular carcinoma (HCC) patients is unsatisfactory due to the high incidence of tumor recurrence and metastasis even after hepatectomy and lack of effective adjuvant therapy [1,2]. Identification of reliable biomarkers that can be used in prediction of tumor recurrence or prognosis of HCC patients ensures more effective clinical management after curative hepatectomy [3].
Cell division cycle and apoptosis regulator 1 (CCAR1) was originally identified as a peri-nuclear phospho-protein reguired for apoptosis signaling by chemotherapy drugs adriamycin and etoposide independent of the p53 status of the human breast cancer cells [4]. Human CCAR1 gene is located on chromosome 10q21-10q22. CCAR1 plays a dynamic role in regulation of cell growth and apoptosis by serving as a cofactor of steroid/thyroid nuclear receptors, β-catenin, and p53 in a variety of cell types including different cancer cells [5,6]. Kim et al. [7] reported that CCAR1 promoted growth of MCF-7 human breast cancer cells in response to estradiol treatment. A recent study showed that CCAR1 was required for growth of prostate cancer cells in part by functioning as a coactivator of androgen receptor transcription [8]. Another study reported that CCAR1 was a binding partner of β-catenin and mediated anchorage independent growth of colon cancer cells [9]. However, whether CCAR1 protein is overexpressed in HCC and the prognostic significance of CCAR1 protein expression in HCC have not been reported.
In 167 HCC patients with long-term follow-up, CCAR1 protein expression was examined by immunohistochemistry to determine whether this protein can serve as a prognostic predictor.
1. Study subjects
HCC tissues from 167 patients who underwent curative hepatectomy from July 2000 to May 2006 at Samsung Medical Center, Seoul, Korea were analyzed. Curative resection was defined as complete resection of all tumor nodules with clear microscopic resection margins and no residual tumors, as indicated by a computed tomography scan 1 month after surgery. All tumor tissues were histologically confirmed. None of the patients received preoperative or postoperative chemotherapy. This study was approved by the Institutional Review Board of Samsung Medical Center. Tumor stages were classified according to both the American Joint Committee on Cancer (AJCC) staging system [10] and Barcelona Clinic Liver Cancer (BCLC) staging classification [11]. Intrahepatic metastasis and multicentric occurrence were defined according to the previously reported criteria [12]. Using 2 years as the cut off, tumor recurrence was classified as either early recurrence or late recurrence [13]. Tumor tissue microarrays were produced as described previously [14]. Two 2-mm cores were taken from paraffin blocks of each specimen.
All patients were followed up every 3 months after surgery and serum α-fetoprotein levels were assessed and three phase dynamic computed tomography scans or magnetic resonance imaging were performed. The median follow-up period was 119.1 months (range, 24.0 to 151.4 months) for survivors. Recurrence-free survival (RFS) was defined from the date of surgery until the date of tumor recurrence, metastasis, or last follow-up. OS was defined from the date of surgery until the date of death or last follow-up. HCC-related death was defined as: (1) tumor occupying more than 80% of the liver, (2) portal venous tumor thrombus proximal to the second bifurcation, (3) obstructive jaundice due to the tumor, (4) distant metastases, or (5) variceal hemorrhage with portal venous tumor thrombus proximal to the first bifurcation [15]. Hepatic failure was defined as the inability of the liver to perform its normal synthetic and metabolic function as part of normal physiology [16].
2. Immunohistochemical analysis
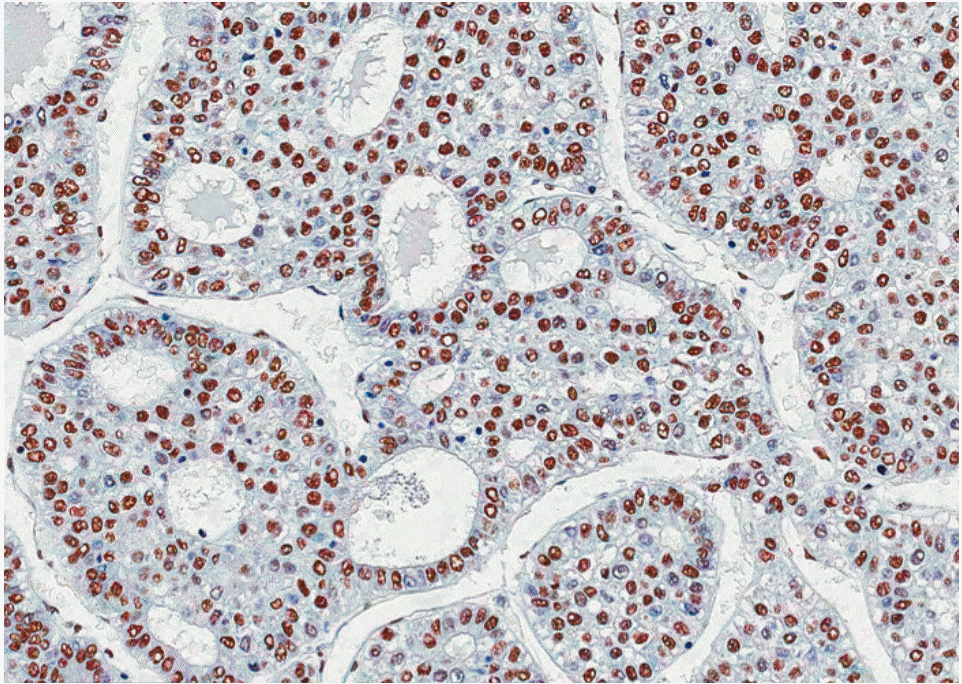
Immunohistochemistry was performed as previously described [14]. Epitope retrieval was performed with 0.01 mol/L citrate buffer at pH 6.0 for 30 minutes in a pressure cooker. The sections were incubated with rabbit polyclonal antibody to CCAR1 (HPA007856, 1:100, Sigma-Aldrich Inc., St. Louis, MO) for 60 minutes at room temperature. To validate the concordance between tissue microarrays and whole tumor sections, CCAR1 expression was also detected for 40 corresponding whole tumor sections randomly chosen from the 167 cases. In negative controls, pre-immune rabbit serum was used to substitute for the primary antibody. Positive controls (human normal kidney) showed nuclear CCAR1 expression in epithelial cells of convoluted tubules.
Immunoreactivity was evaluated independently by two blinded pathologists (C.-K.P. and S.Y.H.). Nearly homogeneous nuclear immunostaining with moderate staining intensity was observed. To determine CCAR1 protein expression, the percentage of tumor cells with positive staining was scored from 0% to 100% and each sample was rated from 0 to 4 (0, < 5%; 1, 5%-25%; 2, 26%-50%; 3, 51%-75%; and 4, > 75%). Duplicate tissue cores for each tumor showed high levels of homogeneity for the proportion of tumor cells with positive staining.
3. Statistical analysis
Statistical analyses were performed using SPSS ver. 18 (SPSS Inc., Chicago, IL). The chi-square test or Fisher exact test was used to examine possible correlations between CCAR1 expression and clinicopathologic factors. A logistic regression analysis was used to predict tumor recurrence. Survival curves were constructed using the Kaplan-Meier method, and differences in survival were evaluated using a log-rank test. Univariate and multivariate analyses of survival were performed using the Cox proportional hazards regression model. Factors with prognostic significance in the univariate analysis were included in the subsequent multivariate analysis. A p-value of < 0.05 was considered to indicate statistical significance.
1. Clinicopathologic patient characteristics
The study included 139 men and 28 women with an average age of 52.5 years (range, 17 to 76 years). The adjacent non-tumor liver had liver cirrhosis in 88 cases (52.7%) (Table 1). Tumor recurrence was detected in 122 patients (73.1%), early recurrence in 98 patients (58.7%), and late recurrence in 24 patients (14.4%). Seventy-two patients (43.1%) died of HCC. Of the 86 deaths, 14 were due to non-HCC causes. Eight of these 14 deaths were due to hepatic failure, five were due to non-hepatic causes, and one was due to unknown cause.
2. CCAR1 protein expression in HCC
In HCC, immunoreactivity for CCAR1 was observed in the nucleus of tumor cells with moderate staining intensity. No immunoreactivity was found in normal hepatocytes. In normal livers, weak CCAR1 immunoreactivity was observed in the nucleus of bile duct epithelial cells, Kupffer cells, and lymphocytes. CCAR1 immunoreactivity was graded as low (0%-50% stained tumor cells regardless of staining intensity) or high expression (> 50% stained tumor cells). High CCAR1 immunoreactivity was observed in 149 of the 167 HCC cases (89.2%) (Fig. 1). High CCAR1 expression showed significant correlation with microvascular invasion (p=0.002), intrahepatic metastasis (p=0.015), and higher AJCC T stage (p=0.017). High CCAR1 expression showed significant correlation with early recurrence (p=0.001), but not with late recurrence (p=0.121) (Table 1).
3. Prediction of early recurrence in HCC
In univariate analysis, early recurrence showed significant correlation with microvascular invasion (p < 0.001), intrahepatic metastasis (p < 0.001), higher AJCC T stage (p < 0.001), higher BCLC stage (p=0.002), lower albumin level (p=0.049), viral etiology (p=0.001), and high CCAR1 expression (p=0.002). To avoid potential bias, because AJCC T stage and BCLC stage were associated with vascular invasion, multiple analyses with these variables were not performed. The significance of serum α-fetoprotein level was not evaluated because of missing data (n=161). In multivariate analysis, intrahepatic metastasis (p=0.010) and viral etiology (p=0.019) were independent predictors of early recurrence (Table 2).
4. Association between CCAR1 expression and prognosis of HCC patients
The RFS and OS rates for 167 HCC patients were 35.7% and 71.7% at 3 years, 32.0% and 60.7% at 5 years, 27.1% and 51.1% at 7 years, and 26.0% and 46.6% at 9 years, respectively. In univariate analysis, larger tumor size, microvascular invasion, major portal vein invasion, intrahepatic metastasis, higher AJCC T stage, higher BCLC stage, and lower albumin level showed unfavorable effects on both RFS and OS. Higher α-fetoprotein level and viral etiology showed unfavorable effects on RFS. High CCAR1 expression showed unfavorable effects on both RFS and OS (Table 3).
The 5-year RFS rate of the high CCAR1 expression group was significantly lower than that of the low CCAR1 expression group (27.1% vs. 72.2%) (p=0.002) (Fig. 2A). The mean RFS was 42.5 months for the high CCAR1 expression group and 100.9 months for the low CCAR1 expression group. In subgroup analysis, among patients with α-fetoprotein ≤ 20 ng/mL (n=54) and patients with AJCC T stage 1 (n=62), significant differences in RFS were observed between high CCAR1 expression groups (n=41 and n=50, respectively) and low CCAR1 expression groups (p=0.015 and p=0.004, respectively) (Fig. 2B and C). In further analysis, among patients with tumor size ≤ 5.0 cm (n=96), no significant difference in RFS was observed between high CCAR1 expression group (n=86) and low CCAR1 expression group (p=0.189) (Fig. 2D).
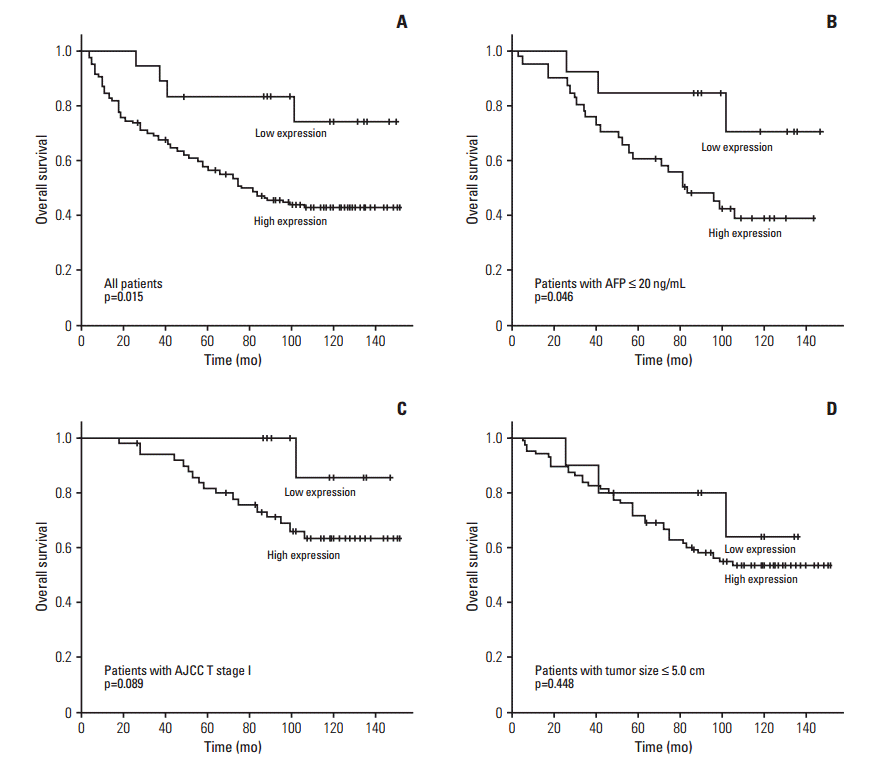
The 5-year OS rate of the high CCAR1 expression group was significantly lower than that of the low CCAR1 expression group (58.0% vs. 83.3%) (p=0.015) (Fig. 3A). The mean OS was 86.9 months for the high CCAR1 expression group and 126.1 months for the low CCAR1 expression group. In subgroup analysis, among patients with α-fetoprotein ≤ 20 ng/mL (n=54), significant difference in OS was observed between high CCAR1 expression group (n=41) and low CCAR1 expression group (p=0.046) (Fig. 3B). In further analysis, among patients with AJCC T stage 1 (n=62), the high CCAR1 expression group (n=50) tended to show an unfavorable effect on OS (p=0.089) (Fig. 3C). Among patients with tumor size ≤ 5.0 cm (n=96), no significant difference in OS was observed between high CCAR1 expression group (n=86) and low CCAR1 expression group (p=0.448) (Fig. 3D).
In multivariate analysis, intrahepatic metastasis and lower albumin level were independent predictors of both shorter RFS and shorter OS. Viral etiology was an independent predictor of shorter RFS. High CCAR1 expression tended to be an independent predictor of shorter RFS (p=0.054), but not shorter OS (p=0.348). Patients with high CCAR1 expression were more likely to suffer from recurrence than those with low CCAR1 expression (hazard ratio, 2.184) (Table 4).
CCAR1 plays important roles in regulation of cancer cell growth in part by recruiting multiple mediators and confers optimal conformation for transcriptional functions of nuclear receptors [7-9]. Apoptosis induction by CCAR1 involves its binding with 14-3-3 protein and down-regulation of cell growth and cell cycle regulators c-Myc, topoisomerase IIα, cyclin B, and p21 Rac1 [4]. Diminished expression of CCAR1 in human breast cancers involved methylation-dependent gene silencing associated with hypermethylation of CCAR1 promoter [17]. CCAR1 functional mimetics (CFMs) are novel small molecule inhibitors of CCAR1 interaction with anaphase promoting complex/cyclosome [18]. CFMs promote apoptosis in a manner independent of p53. CFMs are potent inhibitors of a variety of cancer cells including drug (adriamycin or tamoxifen)–resistant breast cancer cells but not immortalized breast epithelial cells in part by activating apoptosis signaling and diminishing the levels of key cell cycle regulatory proteins [18,19].
This study demonstrates, for the first time, that high CCAR1 protein expression in HCC might be a marker of shorter RFS after curative hepatectomy. High CCAR1 expression showed correlation with microvascular invasion, intrahepatic metastasis, and higher AJCC T stage, suggesting the involvement of CCAR1 in the progression of HCC.
In the current study, tumor recurrence was detected in 35 of 54 patients (64.8%) with normal serum α-fetoprotein levels and in 36 of 62 patients (58.1%) with AJCC T stage 1. Within these patient populations, high CCAR1 expression groups showed unfavorable effects on RFS. Serum α-fetoprotein is an important predictor of HCC recurrence after surgery [20]. Identification of subpopulations with poor prognosis for early stage HCC patients is critical to the optimization of personalized treatment. CCAR1 protein expression may be helpful in prediction of recurrence risk in patients with normal serum α-fetoprotein levels and early stage HCC after curative hepatectomy.
In addition, CCAR1 could be a promising therapeutic target for HCC. A nanolipid formulation of CFM-4 showed superior bioavailability and inhibited growth of xenografted triple-negative breast cancer and non-small cell lung cancer in nude mice, when administered orally [19]. The absence of CCAR1 protein expression in the normal liver enhances the potential of CCAR1 as a treatment target in HCC. Current treatment options for HCCs are limited, thus discovery and development of molecules based on CCAR1 signaling could yield novel tools for treatment of HCCs.
For the first time, the current study demonstrated that CCAR1 protein could be a potential biomarker predicting RFS in HCC patients after curative hepatectomy. In addition, CCAR1 had prognostic values in HCC patients with normal serum α-fetoprotein levels or early stage HCC. Patients with high CCAR1 expression are considered candidates for adjuvant treatment after surgical resection. Further study is needed to determine the underlying molecular mechanism of CCAR1 in the development and progression of HCC.

Conflict of interest relevant to this article was not reported

Acknowledgements
This study was supported by a Samsung Biomedical Research Institute Grant (#OTX0002001).
Fig. 1.
Immunostaining of cell division cycle and apoptosis regulator 1 in hepatocellular carcinoma shows high nuclear immunoreactivity (horseradish peroxidase stain, ×200).
crt-2015-302f1.gif
Fig. 2.
Kaplan-Meier survival curves showing recurrence-free survival among all patients (A), patients with α-fetoprotein (AFP) ≤ 20 ng/mL (B), patients with American Joint Committee on Cancer (AJCC) T stage 1 (C), and patients with tumor size ≤ 5.0 cm (D) according to the cell division cycle and apoptosis regulator 1 expression.
crt-2015-302f2.gif
Fig. 3.
Kaplan-Meier survival curves showing overall survival among all patients (A), patients with α-fetoprotein (AFP) ≤ 20 ng/mL (B), patients with American Joint Committee on Cancer (AJCC) T stage 1 (C), and patients with tumor size ≤ 5.0 cm (D) according to the cell division cycle and apoptosis regulator 1 expression.
crt-2015-302f3.gif
Table 1.
Correlation between CCAR1 expression and the clinicopathologic features in 167 hepatocellular carcinomas
Variable No. CCAR1 high expression p-value
Age (yr)
 ≤ 55 94 86 (91.5) 0.284
 > 55 73 63 (86.3)
Sex
 Female 28 26 (92.9) 0.741
 Male 139 123 (88.5)
Tumor size (cm)
 ≤ 5.0 96 86 (89.6) 0.861
 > 5.0 71 63 (88.7)
Edmondson grade
 I 13 11 (84.6) 0.608
 II 116 101 (87.1)
 III 38 37 (97.4)
Microvascular invasion
 (–) 65 52 (80.0) 0.002
 (+) 102 97 (95.1)
Major portal vein invasion
 (–) 158 140 (88.6) 0.599
 (+) 9 9 (100)
Intrahepatic metastasis
 (–) 116 99 (85.3) 0.015
 (+) 51 50 (98.0)
Multicentric occurrence
 (–) 162 145 (89.5) 0.439
 (+) 5 4 (80.0)
AJCC T stage
 1 62 50 (80.6) 0.017
 2 68 62 (91.2)
 3 35 35 (100)
 4 2 2 (100)
BCLC stage
 0-A 81 73 (90.1) 0.608
 B 76 66 (86.8)
 C 10 10 (100)
Albumin level (g/dL)
 > 3.5 142 124 (87.3) 0.078
 ≤ 3.5 25 25 (100)
AFP level (ng/mL)a)
 ≤ 200 92 79 (85.9) 0.170
 > 200 69 64 (92.8)
Etiology
 Non-viral 22 18 (81.8) 0.540
 HBV 130 117 (90.0)
 HCV 15 14 (93.3)
Liver cirrhosis
 (–) 79 70 (88.6) 0.808
 (+) 88 79 (89.8)
Early recurrence (≤ 2 yr)
 (–)b) 45 34 (75.6) 0.001
 (+) 98 93 (94.9)
Late recurrence (> 2 yr)
 (–)b) 45 34 (75.6) 0.121
 (+) 24 22 (91.7)

Values are presented as number (%). CCAR1, cell division cycle and apoptosis regulator 1; AJCC, American Joint Committee on Cancer; BCLC, Barcelona Clinic Liver Cancer; AFP, α-fetoprotein; HBV, hepatitis B virus; HCV, hepatitis C virus.

a) Partial data were not available,

b) No early or late recurrence.

Table 2.
Univariate and multivariate logistic regression models for predicting early tumor recurrence in 143 hepatocellular carcinomas
Variable Univariate model
Multivariate model
Coefficient OR (95% CI) p-value Coefficient OR (95% CI) p-value
Age (> 55 yr vs. ≤ 55 yr) –0.285 0.752 (0.370-1.528) 0.431 - - -
Sex (male vs. female) –0.588 0.556 (0.192-1.605) 0.278 - - -
Tumor size (> 5.0 cm vs. ≤ 5.0 cm) 0.734 2.083 (0.998-4.347) 0.050 - - -
Edmondson grade (III vs. I+II) 0.565 1.759 (0.727-4.255) 0.210 - - -
Microvascular invasion (yes vs. no) 1.645 5.182 (2.418-11.104) < 0.001 0.865 2.376 (0.943-5.987) 0.067
Major portal vein invasion (yes vs. no) 1.364 3.911 (0.474-32.256) 0.205 - - -
Intrahepatic metastasis (yes vs. no) 2.557 12.902 (3.747-44.430) < 0.001 1.787 5.971 (1.533-23.249) 0.010
Multicentric occurrence (yes vs. no) 0.329 1.389 (0.141-13.738) 0.778 - - -
AJCC T stage (2+3+4 vs. 1) 1.675 5.337 (2.474-11.514) < 0.001 - - -
BCLC stage (B+C vs. A+0) 1.182 3.262 (1.561-6.818) 0.002 - - -
Albumin level (≤ 3.5 g/dL vs. > 3.5 g/dL) 1.278 3.590 (1.008-12.784) 0.049 1.294 3.646 (0.862-15.421) 0.079
AFP levela) (> 200 ng/mL vs. ≤ 200 ng/mL) 0.000 1.000 (0.997-1.002) 0.949 - - -
Etiology (viral vs. non-viral) 1.664 5.281 (1.937-14.403) 0.001 1.371 3.938 (1.258-12.323) 0.019
Liver cirrhosis (yes vs. no) 0.663 1.940 (0.943-3.993) 0.072 - - -
CCAR1 expression (high vs. low) 1.795 6.018 (1.948-18.587) 0.002 0.945 2.573 (0.716-9.247) 0.147

OR, odds ratio; CI, confidence interval; AJCC, American Joint Committee on Cancer; BCLC, Barcelona Clinic Liver Cancer; AFP, α-fetoprotein; CCAR1, cell division cycle and apoptosis regulator 1.

a) Partial data were not available, and statistics were based on the available data.

Table 3.
Univariate analyses of recurrence-free survival and overall survival in 167 hepatocellular carcinomas
Variable Recurrence-free survival
Overall survival
HR (95% CI) p-value HR (95% CI) p-value
Age (> 55 yr vs. ≤ 55 yr) 0.851 (0.593-1.219) 0.378 1.005 (0.657-1.535) 0.983
Sex (male vs. female) 0.840 (0.533-1.322) 0.451 1.297 (0.719-2.341) 0.388
Tumor size (> 5.0 cm vs. ≤ 5.0 cm) 1.653 (1.156-2.363) 0.006 2.143 (1.402-3.277) < 0.001
Edmondson grade (III vs. I+II) 1.384 (0.915-2.092) 0.124 1.542 (0.956-2.487) 0.076
Microvascular invasion (yes vs. no) 2.470 (1.677-3.638) < 0.001 3.324 (2.010-5.497) < 0.001
Major portal vein invasion (yes vs. no) 2.572 (1.250-5.291) 0.010 4.121 (1.968-8.629) < 0.001
Intrahepatic metastasis (yes vs. no) 3.680 (2.516-5.381) < 0.001 4.995 (3.235-7.711) < 0.001
Multicentric occurrence (yes vs. no) 1.309 (0.481-3.560) 0.598 1.157 (0.366-3.664) 0.804
AJCC T stage (2+3+4 vs. 1) 2.531 (1.707-3.752) < 0.001 3.579 (2.123-6.034) < 0.001
BCLC stage (B+C vs. 0+A) 2.084 (1.452-2.992) < 0.001 2.937 (1.874-4.603) < 0.001
Albumin level (≤ 3.5 g/dL vs. > 3.5 g/dL) 1.870 (1.175-2.976) 0.008 2.612 (1.576-4.328) < 0.001
AFP levela) (> 200 ng/mL vs. ≤ 200 ng/mL) 1.493 (1.038-2.147) 0.031 1.291 (0.840-1.985) 0.244
Etiology (viral vs. non-viral) 2.680 (1.357-5.292) 0.005 1.576 (0.789-3.145) 0.197
Liver cirrhosis (yes vs. no) 1.293 (0.902-1.853) 0.162 0.924 (0.605-1.410) 0.713
CCAR1 expression (high vs. low) 3.192 (1.483-6.872) 0.003 3.250 (1.191-8.870) 0.021

HR, hazard ratio; CI, confidence interval; AJCC, American Joint Committee on Cancer; BCLC, Barcelona Clinic Liver Cancer; AFP, α-fetoprotein; CCAR1, cell division cycle and apoptosis regulator 1.

a) Partial data were not available, and statistics were based on the available data.

Table 4.
Multivariate analyses of recurrence-free survival and overall survival in 167 hepatocellular carcinomas
Variable Recurrence-free survival
Overall survival
HR (95% CI) p-value HR (95% CI) p-value
Tumor size (> 5.0 cm vs. ≤ 5.0 cm) 1.170 (0.770-1.777) 0.463 1.131 (0.697-1.836) 0.617
Microvascular invasion (yes vs. no) 1.538 (0.945-2.501) 0.083 1.784 (0.943-3.375) 0.075
Major portal vein invasion (yes vs. no) 0.787 (0.361-1.718) 0.548 1.262 (0.579-2.753) 0.558
Intrahepatic metastasis (yes vs. no) 2.355 (1.461-3.794) < 0.001 3.349 (1.948-5.756) < 0.001
Albumin level (≤ 3.5 g/dL vs. > 3.5 g/dL) 1.666 (1.032-2.690) 0.037 2.765 (1.625-4.706) < 0.001
Etiology (viral vs. non-viral) 2.148 (1.071-4.308) 0.031 - -
CCAR1 expression (high vs. low) 2.184 (0.986-4.833) 0.054 1.646 (0.581-4.668) 0.348

HR, hazard ratio; CI, confidence interval; CCAR1, cell division cycle and apoptosis regulator 1.

  • 1. El-Serag HB, Rudolph KL. Hepatocellular carcinoma: epidemiology and molecular carcinogenesis. Gastroenterology. 2007;132:2557–76. ArticlePubMed
  • 2. Llovet JM, Schwartz M, Mazzaferro V. Resection and liver transplantation for hepatocellular carcinoma. Semin Liver Dis. 2005;25:181–200. ArticlePubMed
  • 3. Qin LX, Tang ZY. Recent progress in predictive biomarkers for metastatic recurrence of human hepatocellular carcinoma: a review of the literature. J Cancer Res Clin Oncol. 2004;130:497–513. ArticlePubMed
  • 4. Rishi AK, Zhang L, Boyanapalli M, Wali A, Mohammad RM, Yu Y, et al. Identification and characterization of a cell cycle and apoptosis regulatory protein-1 as a novel mediator of apoptosis signaling by retinoid CD437. J Biol Chem. 2003;278:33422–35. ArticlePubMed
  • 5. Rishi AK, Zhang L, Yu Y, Jiang Y, Nautiyal J, Wali A, et al. Cell cycle- and apoptosis-regulatory protein-1 is involved in apoptosis signaling by epidermal growth factor receptor. J Biol Chem. 2006;281:13188–98. ArticlePubMed
  • 6. Jiang Y, Puliyappadamba VT, Zhang L, Wu W, Wali A, Yaffe MB, et al. A novel mechanism of cell growth regulation by cell cycle and apoptosis regulatory protein (CARP)-1. J Mol Signal. 2010;5:7.ArticlePubMedPMC
  • 7. Kim JH, Yang CK, Heo K, Roeder RG, An W, Stallcup MR. CCAR1, a key regulator of mediator complex recruitment to nuclear receptor transcription complexes. Mol Cell. 2008;31:510–9. ArticlePubMedPMC
  • 8. Seo WY, Jeong BC, Yu EJ, Kim HJ, Kim SH, Lim JE, et al. CCAR1 promotes chromatin loading of androgen receptor (AR) transcription complex by stabilizing the association between AR and GATA2. Nucleic Acids Res. 2013;41:8526–36. ArticlePubMedPMC
  • 9. Ou CY, Kim JH, Yang CK, Stallcup MR. Requirement of cell cycle and apoptosis regulator 1 for target gene activation by Wnt and beta-catenin and for anchorage-independent growth of human colon carcinoma cells. J Biol Chem. 2009;284:20629–37. ArticlePubMedPMC
  • 10. Edge SB, Byrd DR, Compton CC, Fritz AG, Greene FL, Trotti A 3rd. AJCC cancer staging manual. 7th ed. Chicago, IL: Springer; 2010. p. 191–5.
  • 11. Llovet JM, Bru C, Bruix J. Prognosis of hepatocellular carcinoma: the BCLC staging classification. Semin Liver Dis. 1999;19:329–38. ArticlePubMed
  • 12. Kumada T, Nakano S, Takeda I, Sugiyama K, Osada T, Kiriyama S, et al. Patterns of recurrence after initial treatment in patients with small hepatocellular carcinoma. Hepatology. 1997;25:87–92. ArticlePubMed
  • 13. Imamura H, Matsuyama Y, Tanaka E, Ohkubo T, Hasegawa K, Miyagawa S, et al. Risk factors contributing to early and late phase intrahepatic recurrence of hepatocellular carcinoma after hepatectomy. J Hepatol. 2003;38:200–7. ArticlePubMed
  • 14. Hyeon J, Ahn S, Park CK. CHD1L is a marker for poor prognosis of hepatocellular carcinoma after surgical resection. Korean J Pathol. 2013;47:9–15. ArticlePubMedPMC
  • 15. Hoshida Y, Villanueva A, Kobayashi M, Peix J, Chiang DY, Camargo A, et al. Gene expression in fixed tissues and outcome in hepatocellular carcinoma. N Engl J Med. 2008;359:1995–2004. ArticlePubMedPMC
  • 16. O'Grady JG, Schalm SW, Williams R. Acute liver failure: redefining the syndromes. Lancet. 1993;342:273–5. ArticlePubMed
  • 17. Zhang L, Levi E, Majumder P, Yu Y, Aboukameel A, Du J, et al. Transactivator of transcription-tagged cell cycle and apoptosis regulatory protein-1 peptides suppress the growth of human breast cancer cells in vitro and in vivo. Mol Cancer Ther. 2007;6:1661–72. ArticlePubMed
  • 18. Puliyappadamba VT, Wu W, Bevis D, Zhang L, Polin L, Kilkuskie R, et al. Antagonists of anaphase-promoting complex (APC)-2-cell cycle and apoptosis regulatory protein (CARP)-1 interaction are novel regulators of cell growth and apoptosis. J Biol Chem. 2011;286:38000–17. ArticlePubMedPMC
  • 19. Muthu M, Somagoni J, Cheriyan VT, Munie S, Levi E, Ashour AE, et al. Identification and testing of novel CARP-1 functional mimetic compounds as inhibitors of non-small cell lung and triple-negative breast cancers. J Biomed Nanotechnol. 2015;11:1608–27. ArticlePubMedPMC
  • 20. Johnson PJ. The role of serum alpha-fetoprotein estimation in the diagnosis and management of hepatocellular carcinoma. Clin Liver Dis. 2001;5:145–59. ArticlePubMed

Figure & Data

REFERENCES

    Citations

    Citations to this article as recorded by  
    • A spotlight on the interplay between Wnt/β-catenin signaling and circular RNAs in hepatocellular carcinoma progression
      Alireza Mafi, Hamidreza Rismanchi, Mohaddese Malek Mohammadi, Neda Hedayati, Seyedeh Sara Ghorbanhosseini, Seyed Ali Hosseini, Yasaman Gholinezhad, Rohollah Mousavi Dehmordi, Behrooz Ghezelbash, Fatemeh Zarepour, Seyed Pouya Taghavi, Zatollah Asemi, Mina
      Frontiers in Oncology.2023;[Epub]     CrossRef
    • Uncovering key molecular mechanisms in the early and late-stage of papillary thyroid carcinoma using association rule mining algorithm
      Seyed Mahdi Hosseiniyan Khatibi, Sepideh Zununi Vahed, Hamed Homaei Rad, Manijeh Emdadi, Zahra Akbarpour, Mohammad Teshnehlab, Saeed Pirmoradi, Effat Alizadeh, Suyan Tian
      PLOS ONE.2023; 18(11): e0293335.     CrossRef
    • The genetic source tracking of human urinary exosomes
      Qingfu Zhu, Liming Cheng, Chunyu Deng, Liu Huang, Jiaoyuan Li, Yong Wang, Meng Li, Qinsi Yang, Xianjun Dong, Jianzhong Su, Luke P. Lee, Fei Liu
      Proceedings of the National Academy of Sciences.2021;[Epub]     CrossRef
    • CCAR1 and CCAR2 as gene chameleons with antagonistic duality: Preclinical, human translational, and mechanistic basis
      Gavin S. Johnson, Praveen Rajendran, Roderick H. Dashwood
      Cancer Science.2020; 111(10): 3416.     CrossRef
    • Quantitative proteomics reveal antidepressant potential protein targets of xiaochaihutang in corticosterone induced model of depression
      Kuo Zhang, Meiyao He, Dongmei Su, Xing Pan, Yuting Li, Haotian Zhang, Jingyu Yang, Chunfu Wu
      Journal of Ethnopharmacology.2019; 231: 438.     CrossRef
    • CCAR-1 affects hemidesmosome biogenesis by regulating unc-52/perlecan alternative splicing in the C. elegans epidermis
      Rong Fu, Yi Zhu, Xiaowan Jiang, Yuanbao Li, Ming Zhu, Mengqiu Dong, Zhaohui Huang, Chunxia Wang, Michel Labouesse, Huimin Zhang
      Journal of Cell Science.2018;[Epub]     CrossRef
    • Short-term transcriptome and microRNAs responses to exposure to different air pollutants in two population studies
      Almudena Espín-Pérez, Julian Krauskopf, Marc Chadeau-Hyam, Karin van Veldhoven, Fan Chung, Paul Cullinan, Jolanda Piepers, Marcel van Herwijnen, Nadine Kubesch, Glòria Carrasco-Turigas, Mark Nieuwenhuijsen, Paolo Vineis, Jos C.S. Kleinjans, Theo M.C.M. de
      Environmental Pollution.2018; 242: 182.     CrossRef
    • Gene expression changes associated with chemotherapy resistance in Ewing sarcoma cells
      Leonardo Horbach, Marialva Sinigaglia, Camila da Silva, Danielly Olguins, Lauro Gregianin, Algemir Brunetto, Andr� Brunetto, Rafael Roesler, Caroline de Farias
      Molecular and Clinical Oncology.2018;[Epub]     CrossRef
    • A CREB1/miR-433 reciprocal feedback loop modulates proliferation and metastasis in colorectal cancer
      Li Yan, Wei-Qiang You, Neng-Quan Sheng, Jian-Feng Gong, Lan-Dian Hu, Ge-Wen Tan, Hong-Qi Chen, Zhi-Gang Wang
      Aging.2018; 10(12): 3774.     CrossRef
    • An individualized prognostic signature and multi-omics distinction for early stage hepatocellular carcinoma patients with surgical resection
      Lu Ao, Xuekun Song, Xiangyu Li, Mengsha Tong, You Guo, Jing Li, Hongdong Li, Hao Cai, Mengyao Li, Qingzhou Guan, Haidan Yan, Zheng Guo
      Oncotarget.2016; 7(17): 24097.     CrossRef

    • PubReader PubReader
    • ePub LinkePub Link
    • Cite
      CITE
      export Copy Download
      Close
      Download Citation
      Download a citation file in RIS format that can be imported by all major citation management software, including EndNote, ProCite, RefWorks, and Reference Manager.

      Format:
      • RIS — For EndNote, ProCite, RefWorks, and most other reference management software
      • BibTeX — For JabRef, BibDesk, and other BibTeX-specific software
      Include:
      • Citation for the content below
      The Overexpression of CCAR1 in Hepatocellular Carcinoma Associates with Poor Prognosis
      Cancer Res Treat. 2016;48(3):1065-1073.   Published online October 16, 2015
      Close
    • XML DownloadXML Download
    The Overexpression of CCAR1 in Hepatocellular Carcinoma Associates with Poor Prognosis
    Image Image Image
    Fig. 1. Immunostaining of cell division cycle and apoptosis regulator 1 in hepatocellular carcinoma shows high nuclear immunoreactivity (horseradish peroxidase stain, ×200).
    Fig. 2. Kaplan-Meier survival curves showing recurrence-free survival among all patients (A), patients with α-fetoprotein (AFP) ≤ 20 ng/mL (B), patients with American Joint Committee on Cancer (AJCC) T stage 1 (C), and patients with tumor size ≤ 5.0 cm (D) according to the cell division cycle and apoptosis regulator 1 expression.
    Fig. 3. Kaplan-Meier survival curves showing overall survival among all patients (A), patients with α-fetoprotein (AFP) ≤ 20 ng/mL (B), patients with American Joint Committee on Cancer (AJCC) T stage 1 (C), and patients with tumor size ≤ 5.0 cm (D) according to the cell division cycle and apoptosis regulator 1 expression.
    The Overexpression of CCAR1 in Hepatocellular Carcinoma Associates with Poor Prognosis
    Variable No. CCAR1 high expression p-value
    Age (yr)
     ≤ 55 94 86 (91.5) 0.284
     > 55 73 63 (86.3)
    Sex
     Female 28 26 (92.9) 0.741
     Male 139 123 (88.5)
    Tumor size (cm)
     ≤ 5.0 96 86 (89.6) 0.861
     > 5.0 71 63 (88.7)
    Edmondson grade
     I 13 11 (84.6) 0.608
     II 116 101 (87.1)
     III 38 37 (97.4)
    Microvascular invasion
     (–) 65 52 (80.0) 0.002
     (+) 102 97 (95.1)
    Major portal vein invasion
     (–) 158 140 (88.6) 0.599
     (+) 9 9 (100)
    Intrahepatic metastasis
     (–) 116 99 (85.3) 0.015
     (+) 51 50 (98.0)
    Multicentric occurrence
     (–) 162 145 (89.5) 0.439
     (+) 5 4 (80.0)
    AJCC T stage
     1 62 50 (80.6) 0.017
     2 68 62 (91.2)
     3 35 35 (100)
     4 2 2 (100)
    BCLC stage
     0-A 81 73 (90.1) 0.608
     B 76 66 (86.8)
     C 10 10 (100)
    Albumin level (g/dL)
     > 3.5 142 124 (87.3) 0.078
     ≤ 3.5 25 25 (100)
    AFP level (ng/mL)a)
     ≤ 200 92 79 (85.9) 0.170
     > 200 69 64 (92.8)
    Etiology
     Non-viral 22 18 (81.8) 0.540
     HBV 130 117 (90.0)
     HCV 15 14 (93.3)
    Liver cirrhosis
     (–) 79 70 (88.6) 0.808
     (+) 88 79 (89.8)
    Early recurrence (≤ 2 yr)
     (–)b) 45 34 (75.6) 0.001
     (+) 98 93 (94.9)
    Late recurrence (> 2 yr)
     (–)b) 45 34 (75.6) 0.121
     (+) 24 22 (91.7)
    Variable Univariate model
    Multivariate model
    Coefficient OR (95% CI) p-value Coefficient OR (95% CI) p-value
    Age (> 55 yr vs. ≤ 55 yr) –0.285 0.752 (0.370-1.528) 0.431 - - -
    Sex (male vs. female) –0.588 0.556 (0.192-1.605) 0.278 - - -
    Tumor size (> 5.0 cm vs. ≤ 5.0 cm) 0.734 2.083 (0.998-4.347) 0.050 - - -
    Edmondson grade (III vs. I+II) 0.565 1.759 (0.727-4.255) 0.210 - - -
    Microvascular invasion (yes vs. no) 1.645 5.182 (2.418-11.104) < 0.001 0.865 2.376 (0.943-5.987) 0.067
    Major portal vein invasion (yes vs. no) 1.364 3.911 (0.474-32.256) 0.205 - - -
    Intrahepatic metastasis (yes vs. no) 2.557 12.902 (3.747-44.430) < 0.001 1.787 5.971 (1.533-23.249) 0.010
    Multicentric occurrence (yes vs. no) 0.329 1.389 (0.141-13.738) 0.778 - - -
    AJCC T stage (2+3+4 vs. 1) 1.675 5.337 (2.474-11.514) < 0.001 - - -
    BCLC stage (B+C vs. A+0) 1.182 3.262 (1.561-6.818) 0.002 - - -
    Albumin level (≤ 3.5 g/dL vs. > 3.5 g/dL) 1.278 3.590 (1.008-12.784) 0.049 1.294 3.646 (0.862-15.421) 0.079
    AFP levela) (> 200 ng/mL vs. ≤ 200 ng/mL) 0.000 1.000 (0.997-1.002) 0.949 - - -
    Etiology (viral vs. non-viral) 1.664 5.281 (1.937-14.403) 0.001 1.371 3.938 (1.258-12.323) 0.019
    Liver cirrhosis (yes vs. no) 0.663 1.940 (0.943-3.993) 0.072 - - -
    CCAR1 expression (high vs. low) 1.795 6.018 (1.948-18.587) 0.002 0.945 2.573 (0.716-9.247) 0.147
    Variable Recurrence-free survival
    Overall survival
    HR (95% CI) p-value HR (95% CI) p-value
    Age (> 55 yr vs. ≤ 55 yr) 0.851 (0.593-1.219) 0.378 1.005 (0.657-1.535) 0.983
    Sex (male vs. female) 0.840 (0.533-1.322) 0.451 1.297 (0.719-2.341) 0.388
    Tumor size (> 5.0 cm vs. ≤ 5.0 cm) 1.653 (1.156-2.363) 0.006 2.143 (1.402-3.277) < 0.001
    Edmondson grade (III vs. I+II) 1.384 (0.915-2.092) 0.124 1.542 (0.956-2.487) 0.076
    Microvascular invasion (yes vs. no) 2.470 (1.677-3.638) < 0.001 3.324 (2.010-5.497) < 0.001
    Major portal vein invasion (yes vs. no) 2.572 (1.250-5.291) 0.010 4.121 (1.968-8.629) < 0.001
    Intrahepatic metastasis (yes vs. no) 3.680 (2.516-5.381) < 0.001 4.995 (3.235-7.711) < 0.001
    Multicentric occurrence (yes vs. no) 1.309 (0.481-3.560) 0.598 1.157 (0.366-3.664) 0.804
    AJCC T stage (2+3+4 vs. 1) 2.531 (1.707-3.752) < 0.001 3.579 (2.123-6.034) < 0.001
    BCLC stage (B+C vs. 0+A) 2.084 (1.452-2.992) < 0.001 2.937 (1.874-4.603) < 0.001
    Albumin level (≤ 3.5 g/dL vs. > 3.5 g/dL) 1.870 (1.175-2.976) 0.008 2.612 (1.576-4.328) < 0.001
    AFP levela) (> 200 ng/mL vs. ≤ 200 ng/mL) 1.493 (1.038-2.147) 0.031 1.291 (0.840-1.985) 0.244
    Etiology (viral vs. non-viral) 2.680 (1.357-5.292) 0.005 1.576 (0.789-3.145) 0.197
    Liver cirrhosis (yes vs. no) 1.293 (0.902-1.853) 0.162 0.924 (0.605-1.410) 0.713
    CCAR1 expression (high vs. low) 3.192 (1.483-6.872) 0.003 3.250 (1.191-8.870) 0.021
    Variable Recurrence-free survival
    Overall survival
    HR (95% CI) p-value HR (95% CI) p-value
    Tumor size (> 5.0 cm vs. ≤ 5.0 cm) 1.170 (0.770-1.777) 0.463 1.131 (0.697-1.836) 0.617
    Microvascular invasion (yes vs. no) 1.538 (0.945-2.501) 0.083 1.784 (0.943-3.375) 0.075
    Major portal vein invasion (yes vs. no) 0.787 (0.361-1.718) 0.548 1.262 (0.579-2.753) 0.558
    Intrahepatic metastasis (yes vs. no) 2.355 (1.461-3.794) < 0.001 3.349 (1.948-5.756) < 0.001
    Albumin level (≤ 3.5 g/dL vs. > 3.5 g/dL) 1.666 (1.032-2.690) 0.037 2.765 (1.625-4.706) < 0.001
    Etiology (viral vs. non-viral) 2.148 (1.071-4.308) 0.031 - -
    CCAR1 expression (high vs. low) 2.184 (0.986-4.833) 0.054 1.646 (0.581-4.668) 0.348
    Table 1. Correlation between CCAR1 expression and the clinicopathologic features in 167 hepatocellular carcinomas

    Values are presented as number (%). CCAR1, cell division cycle and apoptosis regulator 1; AJCC, American Joint Committee on Cancer; BCLC, Barcelona Clinic Liver Cancer; AFP, α-fetoprotein; HBV, hepatitis B virus; HCV, hepatitis C virus.

    Partial data were not available,

    No early or late recurrence.

    Table 2. Univariate and multivariate logistic regression models for predicting early tumor recurrence in 143 hepatocellular carcinomas

    OR, odds ratio; CI, confidence interval; AJCC, American Joint Committee on Cancer; BCLC, Barcelona Clinic Liver Cancer; AFP, α-fetoprotein; CCAR1, cell division cycle and apoptosis regulator 1.

    Partial data were not available, and statistics were based on the available data.

    Table 3. Univariate analyses of recurrence-free survival and overall survival in 167 hepatocellular carcinomas

    HR, hazard ratio; CI, confidence interval; AJCC, American Joint Committee on Cancer; BCLC, Barcelona Clinic Liver Cancer; AFP, α-fetoprotein; CCAR1, cell division cycle and apoptosis regulator 1.

    Partial data were not available, and statistics were based on the available data.

    Table 4. Multivariate analyses of recurrence-free survival and overall survival in 167 hepatocellular carcinomas

    HR, hazard ratio; CI, confidence interval; CCAR1, cell division cycle and apoptosis regulator 1.


    Cancer Res Treat : Cancer Research and Treatment
    Close layer
    TOP