Introduction
Dihydrofolate reductase (DHFR) is a key enzyme of the folate cycle and the metabolism of one carbon unit catalyzes the NADPH-dependent reduction of dihydrofolate (DHF) to tetrahydrofolate (THF) (1). DHFR enzymatic activity is necessary for the biosynthesis of purine and thymidine, which is required for DNA polymerization (2).
Methotrexate (MTX) is a potent inhibitor of the DHFR, which plays a key role in intracellular folate metabolism, and the DHFR is essential for DNA synthesis and cell growth (3). MTX is a classical antimetabolite and it is currently widely used as a major chemotherapeutic agent for human malignancies such as acute lymphoblastic leukemia, malignant lymphoma, osteosarcoma, breast cancer and head and neck cancer (2,4,5).
Unfortunately, its clinical efficacy is often compromised by the acquisition of resistance in cancer cells (2). In mammalian cancer cells, the resistance to MTX occurs through a variety of mechanisms, including a reduction of MTX uptake by reduced folate carrier (RFC), an increase of MTX efflux due to the over-expression of several ATP-binding cassette (ABC) transporters, a decrease of MTX polyglutamation by folypolyglutamate synthetase, the over-expression of DHFR protein by amplification of the DHFR gene, a decreased affinity to MTX by mutation of the DHFR and combinations of these mechanisms (3,6).
Transport of MTX is an essential determinant for generating a sufficient MTX intracellular concentration. MTX is predominantly delivered into cells by RFC, which is a bi-directional anion exchanger that contains 12 putative transmembrane domains. RFC is ubiquitously expressed in normal tissues, yet its regulatory mechanisms are not yet clearly understood. Transcription of the RFC starts from at least four distinct promoters, (designated A, B, C and D), and this is complicated by multiple 5'-non-coding exons that are brought about by alternative splicing. At least 18 different RFC transcripts have been reported, but the functions of these are not yet clear, although links to tissue specific expression has been suggested (7). Further information on RFC regulation is important to understand the mechanisms of MTX resistance in several type of cancer.
In both experimental and clinical settings, increased levels of DHFR and a the decreased DHFR-binding affinity of MTX have been commonly observed in the cancer cells that manifest a MTX-resistant phenotype. The increased reductase activity may result from DHFR amplification, enhanced transcription or efficient translation of DHFR messages. Several phenomena supporting these molecular alterations of the DHFR have been documented in the MTX-resistant cells derived from clinical samples. Thus, the DHFR status in both target and non-target cells has crucial roles in the sensitivity and resistance to MTX and the DHFR status might be involved in the occurrence of adverse drug reactions in individual patient (1,8).
Changes in the level of the DHFR expression and in the sensitivity to MTX also may occur due to DHFR's genetic polymorphisms, and particularly those located in the regulatory elements (9). Recently, it seems to be clear that the polymorphisms in the carriers and enzymes involved in the folate metabolic pathway are potentially responsible for MTX resistance or an increased risk of serious adverse events. Polymorphisms of the MTX transporter (i.e., RFC 80G>A), MTX targets (i.e., DHFR 19-bp deletion and TS enhancer 28-bp tandem repeat) and the folate-metabolizing enzyme (i.e., MTHFR 677C>T and 1298A>C) can affect the anti-tumor activity and toxicities of MTX. The influence of folate polymorphisms in relation with MTX-related toxicity has recently been studied mainly in childhood acute lymphoblastic leukemia, while only a few studies have investigated this relationship in adult hematological patients (10,11).
In this study, we examined the cytotoxicity of MTX in six cancer cell lines for which MTX is currently being used as a single drug or in a combined manner; human non-small cell lung cancer (NCI-H2, A549), breast cancer (MCF-7), gastric cancer (AGS), colon cancer (HCT-116) and osteosarcoma (Saos-2). In order to investigate whether or not the RFC and DHFR play important functional roles in MTX cytotoxicity, we observed their mRNA and protein expression levels and we analyzed the genotypes of their novel and known polymorphisms.
Materials and Methods
1. Chemicals
Methotrexate was purchased from Sigma Aldrich (St. Louis, MO) and the stock solution of MTX was stored at 4℃. The drug was dissolved in 250 mM of sodium carbonate to prepare 50 mM of the MTX stock solutions. The diluted working solution was stored at -20℃ before use. [3',5',7-3H]MTX (25.3 Ci/mmoL) was purchased from Moravek Biochemicals (Brea, CA).
2. Cell lines
The six cancer cell lines were purchased from the Seoul National University Culture Collection (Korean cell line bank, http://cellbank.snu.ac.kr/SNU). They were established from human non-small cell lung cancer (NCI-H23, A549), breast cancer (MCF-7), gastric cancer (AGS), colon cancer (HCT-116), and osteosarcoma (Saos-2), and MTX is currently being used to treat these cancers as a single treatment or as part of combination treatment.
3. Cell culture
All cell lines were routinely cultured in RPMI 1640 medium or DMEM supplemented with 10% heat-inactivated fetal bovine serum, penicillin-streptomycin (50 U/mL) and 25 mM 4-(2-hydroxyethyl)-1-piperazineethanesulfonic acid (HEPES). The human osteosarcoma Saos-2 and gastric carcinoma AGS cell lines were cultured in RPMI 1640 medium, whereas the human NSCLC cell line A549 was cultured in DMEM. The cells were maintained at 37℃ in an incubator under a humidified atmosphere containing 5% carbon dioxide.
4. Cytotoxicity assay
The cytotoxicity of MTX was repeatedly tested at 8 different concentrations for control: 0.03, 0.1, 0.3, 1, 3, 10, 30 and 100 µg/mL. To evaluate the cytotoxicity, the cells were seeded in 96-well plates (Nalgen Nunc International, Rochester, NY) at a concentration of 2.5×10³ cells/mL for the A549 and AGS cells. The Saos-2 cells were seeded at a concentration of 5.0×10³ cells/mL. The cells were incubated for 24 hours to allow sufficient cell adhesion, and all the microplates were incubated for a total of 72 hours after MTX administration. The cytotoxic activity was measured by the sulforhodamine B (SRB) assay according to the manufacture's instructions (12). The SRB test was initiated by fixing the cells via addition of 200 µL of 10% trichloracetic acid (Sigma, St. Louis, MO) and the plate was incubated for 1 hour at 4℃. Afterwards, the wells were rinsed 3 times with distilled water and then dried. The cells were stained with 110 µL SRB (0.4%) (Sigma) for 15 minutes and they were rinsed 3 times in 1% glacial acetic acid. After drying the 96 well plate, 100 µL of 10 mM Tris buffer was added per well to release the dye. After mixing, the absorbance at 560 nm was measured using an ELISA reader (Spectra Max 250, Molecular Devices, GMI Inc., Ramsey, MN). Each experiment was performed using 6 replicated wells at same drug concentrations. The enzymatic activity of the viable cells at each concentration was expressed as the relative percent absorbance compared with the control well without drug exposure. The dose-effect curves were generated and the drug sensitivity to MTX was expressed as a drug concentration that caused 50% growth inhibition (IC50). All the experiments were repeated more than three times.
5. RNA isolation and quantitative real-time PCR (qRT-PCR)
Real-time fluorescence detection was performed to analyze the relative levels of RFC (NM_194255.1) and DHFR (NM_000791.3) mRNA. The cells were incubated in IC50 concentrations of MTX for 72 hours and the MTX untreated cells were used as controls. The total RNA was extracted from the cell pellets using WelPrep total RNA isolation reagent (Welgene, Daegu) and by following the recommendations of the manufacturer. The complementary DNA was synthesized in a Maxime RT premix kit (Maxime RT premix, Intron, Daejon), according to standard procedures. Gene expression analyses were carried out by using SYBR® Premix Ex Taq™ (Roche, Germany). The gene targets were amplified with the following primers: DHFR-forward ATGCCTTAAAACTTACTGAACAACCA; DHFR-reverse TGGGTGATTCATGGCTTCCT; RFC-forward AGTTCCTCG TGCCCAT; RFC-reverse GTCCGAGACAATGAAAGTGAT. PCR amplifications were carried out with by performing RT-PCR (Stratagene, Cedar Creek, TX) for 40 cycles (95℃ for 5 seconds, 63℃ for 20 seconds, 72℃ for 1 minute) after an initial incubation step at 95℃ for 10 seconds. For each sample, the PCR reaction was carried out in triplicate. Glyceraldehyde-3-phosphate dehydrogenase (GAPDH) was used as the housekeeping gene.
6. Western blot analysis
The cells were incubated with different concentrations (0, 1, 10, 100, and 1,000 nM) of the MTX or an equivalent amount of medium for 72 hours for the AGS and Saos-2 cells. After incubation, the cells were washed, harvested and then disrupted on ice for 30 minutes using RIPA lysis buffer (Sigma) supplemented with protease inhibitors (Sigma), and then this was centrifuged at 14,000×g for 25 minutes at 4℃. The supernatants were used for Western blot analysis. The protein concentration was determined using the NOVEX mini-cell protein assay kit (Invitrogen Inc., Carlsbad, CA). An equal amount of protein was separated by 10% sodium dodecyl sulfate polyacrylamide electrophoresis (SDS-PAGE) and this protein was transferred onto polyvinylidenedifluoride membranes, immunoblotted with specific primary and secondary antibodies and then visualized using the ECL™ Western blotting analysis system kit (Amersham™, Amersham Biosciences, Sweden). DHFR antibody was purchased from Abnova (Taiwan). The antibodies to activated RFC were purchased from Santa Cruz Biotechnology (Santa Cruz, CA).
7. [3H]MTX transport
The cells were seeded at high density (1×10⁴) onto 96-well plate. The cells were maintained at 37℃ in an incubator under a humidified atmosphere containing 5% carbon dioxide. Uptake of [3H]MTX was carried out at 37℃ with an extracellular concentration, 1, 10, and 100 nM. The cells were incubated for 5 minutes at 37℃ and then they were washed with ice-cold PBS (pH 7.4) and next fixed with 5% TCA solution. After washing with ice-cold PBS (pH7.4), the final cell pellet was solubilized; the radioactivity was estimated by counting via liquid scintillation (11,12).
8. Identification of novel SNPs in the DHFR
The 20 unrelated subjects who were selected via health screening at Seoul St. Mary's Hospital and were free of any clinical or biochemical signs of disease were used to discover novel polymorphisms for this study. This study was approved by the Institutional Review Board (IRB) of Seoul St. Mary's Hospital. The promoter, exons and flanking intron sequences of the DHFR gene were screened by direct sequencing; gene-specific primer pairs were used to amplify the DHFR gene. The sample sizes were selected on the basis of the following assumptions: the present study would have a 99%detection rate to detect SNPs with over 5% minor allele frequencies. DNA fragments of -400 bp each spanning an exon and the adjacent intronic sequences or the proximal promoter sequences were designed based on the GenBank sequences (Ref. Genome seq; NC_000005.8). DHFR was screened using BigDye Terminator Cycle Sequencing reagents on an ABI 3730 automate sequencer (Applied Biosystems, Foster City, CA). The Sequencher software (Gene Codes Corporation, Ann Arbor, MI) was used to align the sequence of the and facilitate the detection of the polymorphisms.
9. Genotyping
We evaluated the genetic variations of the RFC and DHFR that may influence MTX sensitivity. The amplification mixture contained 2.5 mM of each dNTP, 1 unit of Ace-Taq polymerase (Genemed, Seoul), 10× of the supplied PCR buffer that contained 1.5 mM MgCl2, 100 ng of genomic DNA and 0.5 µM of each primer. The reaction was started with an enzyme reaction step at 95℃ for 5 minutes, followed by 35 cycles of 95℃ for 30 seconds, 60℃ for 30 seconds and 72℃ for 1 minute, and this was ended at 72℃ for 5 minutes as a final extension step. These PCR products were purified using the Labopass™ Gel and PCR clean-up kit (Cosmo Genetech, Seoul). The purified PCR products were sequenced with their specific primers using the ABI PRISM® BigDyeTM Terminator Ready Reaction Cycle Sequencing Kit (Applied Biosystems). The sequenced products were analysed by ABI PRISM 3730XL Genetic Analyzer; Genotyper 2.5 software (Applied Biosystems).
Results
1. Cytotoxic activities of MTX
We determined the cytotoxicity of MTX in the 6 cancer cell lines after 72 hours of exposure to different concentrations of MTX (range of concentrations, 0.03 to 1000 nM). The IC50s of MTX was in an extensively broad range from 6.05±0.81 nM to >1,000 nM in the 6 cancer cell lines. The Saos-2 (>1,000 nM) and MCF-7 (114.31±5.34 nM) cells were most resistant to MTX; more than 50% of cells of the Saos-2 and MCF-2 cell lines were viable up to 1,000 nM (62% and 50%, respectively) (Fig. 1). In contrast, the AGS and HCT-116 cells were highly sensitive to MTX with an IC50 of 6.05±0.81 nM and 13.56±3.76 nM, respectively. In the two non-small cell lung cancer cell lines, the NCI-H23 and A549 cells demonstrated similar sensitivity to MTX (IC50, 38.25±4.91 nM and 38.33±8.42 nM, respectively).
2. Expression of the mRNA transcripts of the RFC and DHFR
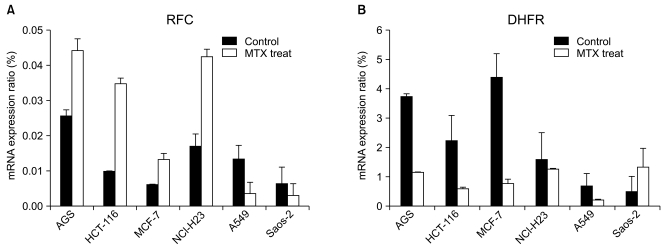
In order to investigate whether or not the RFC and DHFR play an important role in the MTX cytotoxicity, we evaluated their mRNA expression by performing RT-PCR analysis (Fig. 2).
Before MTX treatment, the mRNA transcript of the RFC was most highly expressed in the MTX-sensitive cell line AGS (0.0256). In the MTX-resistant cell lines Saos-2 and MCF-7, the expression levels of the RFC mRNA transcripts were very low. After MTX treatment, the expressed level of the RFC mRNA transcript in the AGS, HCT-116 and NCI-H23 cells increased 1.7- to 3.6-fold. However, the A549 and Saos-2 cells showed a 2- to 3.8-fold decrease of the RFC mRNA expression when compared with that of the untreated cells.
The baseline level of the DHFR mRNA transcript was 2.26 and 1.57 in the HCT-116 and NCI-H23 cells, respectively. The basal expression level of the DHFR mRNA transcript in the MTX-sensitive AGS cells was about 7.5-fold higher than that of the MTX-resistant Saos-2 cells (3.73 vs. 0.499, respectively). After MTX treatment, the DHFR mRNA expression decreased 1.2- to 5.6-fold in the AGS, HCT-116, MCF-7, A549 and NCI-H23 cells. On the contrary, the mRNA expression of the DHFR in theSaos-2 cells was 2.7-fold higher than that of the untreated control. A reciprocal change of the RFC and DHFR mRNA transcripts was found between the MTX-sensitive AGS cells and the MTX-resistant Saos-2 cells.
3. The RFC and DHFR's protein expressions
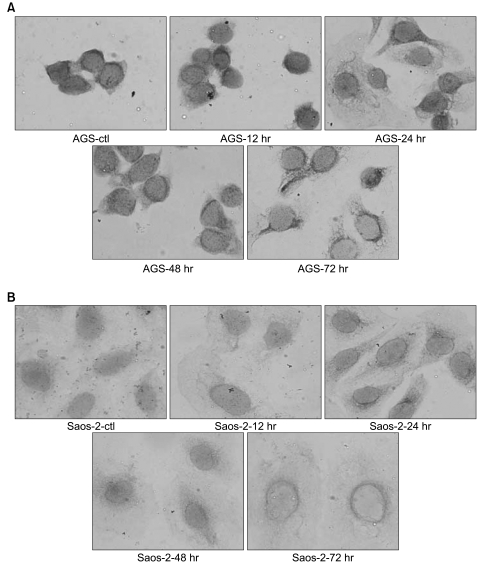
We investigated the protein expression levels of the RFC and DHFR in the AGS and Saos-2 cells, which showed the greatest difference in cytotoxic activity, by performing Western blot analysis (Fig. 3). There was no significant difference in the basal levels of RFC protein in both the AGS and Saos-2 cells. When treated with MTX, the RFC protein expression was not different in the dose-dependent manner as compared with the pretreatment level. In contrast, the DHFR protein expressions increased in a dose-dependent manner in the MTX-treated AGS and Saos-2 cells. In order to investigate the intracellular distribution of the RFC transporter in these cells, we observed the expression pattern of the RFC by performing immunocytochemistry (ICC). However, despite of MTX treatment, there were no dose- and time-dependent changes of the RFC protein expression in these two cells.
4. [3H]MTX transport
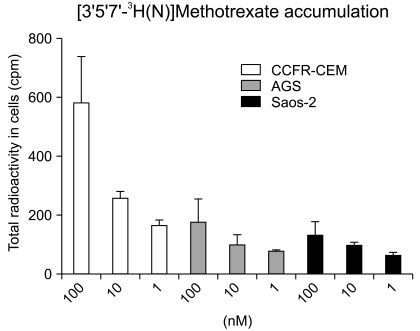
In order to explain the differences in sensitivity to MTX between the AGS and Saos-2 cell lines, the RFC uptake was assessed and determined as a possible factor that contributed to drug sensitivity. The intracellular [3H]MTX concentration was slightly higher in the MTX-sensitive AGS cells than that in the MTX-resistant Saos-2 cells. The [3H]MTX uptake in the AGS and Saos-2 cells was gradually impaired as compared to that of the control cells (CCRF-CEM as the control) (Fig. 4).
5. Genotyping of the DHFR
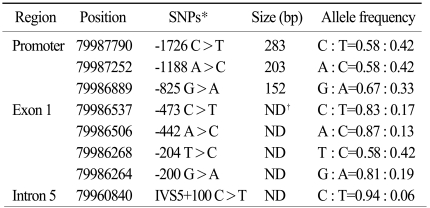
We previously screened the promoter, exons and flanking intron sequences of the DHFR by direct sequencing in randomly selected normal individuals (Table 1). The variants having a minor allele frequency below 5% were not included in the analysis of the DHFR genetic variants. We have identified 8 novel polymorphisms (three in the promoter, four in exon 1 and one in intron 5). The genomic structure and their locations in the DHFR in the healthy population are shown in Fig. 5. In this study, we selected the -1726C>T (rs380691), -1188A>C (rs442767) and -825G>A (rs408626), genetic variations within the promoter region and the 721A>T (rs7387) variant in exon 1. We genotyped three novel polymorphisms and one known polymorphism of the DHFR and two conventional polymorphisms of the RFC, that is, 80G>A (rs1051266) and 696T>C (rs12659).
6. Association between the genetic variants of the RFC and DHFR and the cytotoxicity of MTX
The diverse distributions of the RFC 80G>A and 696T>C genotypes were observed among the six cell lines. The genotypes of the RFC were homozygous 80AA and 696TT in the MTX-sensitive AGS cells, whereas the Saos-2 cells had the 80AG and 696TC heterozygote genotypes. The A549 and NCI-H23 cells that showed a moderate level of MTX cytotoxicity had the 80GG and 696CC homozygous genotypes in the RFC. The genotypes of the MTX-sensitive AGS cells were mutant variants of -1726TT, -1188CC and -825AA in the DHFR. In contrast, the Saos-2 cells had the wild-type of -1726CC, -1188AA and -825GG. The NCI-H23 and A549 cells carried the -1726TT and -1188CC genotype that contained the minor alleles of the DHFR variant. The genotype of 721A>T in the DHFR gene showed different patterns in the 6 cancer cell lines (Table 2).
Discussion
Several resistance mechanisms of MTX have been proposed; impaired cellular uptake and efflux, decreased formation of MTX-polyglutamates (MTX-PGs) and reduced binding affinity to its target, DHFR etc (13,14). These mechanisms could eventually be classified into two major phenomenons: 1) the increased DHFR enzyme level due to DHFR gene over-expression and 2) the reduced intracellular transport of MTX at the cell membrane (3).
We investigated the cytotoxicity of MTX in six cancer cell lines for which MTX is being commonly used for the treatment of malignant tumors. We examined the influence of the genetic variations in the RFC and DHFR on the cytotoxicity of MTX. The Saos-2 and MCF-7 cells were most resistant to MTX; in contrast, the AGS and HCT-116 cells were highly sensitive to MTX. It was observed that 50 to 62% of the cells were viable even at more than 1,000 nM of MTX in the Saos-2 and MCF-7 cell lines. In the previous studies, several transformed cells derived from the Saos-2 sarcoma cell line demonstrated similar resistance to MTX (15). A wide range of the IC50 (0.027 to 10 µM) was observed in lymphoma cell lines and several ALL cell lines (16). In our study, the cytotoxicities of MTX in the 6 cancer cell lines were similar to the previously reported data.
For human leukemia cell lines, it was reported that genetic mutation disrupting the transport activity of the RFC might be a major mechanism of the resistance to the antifolates such as MTX and Tomudex (Raltitrexed, ZD1694). In the pediatric osteosarcomas, it was proposed that impaired intracellular transport of MTX by decreased RFC levels is the most feasible mechanism of acquired resistance (17,18).
We investigated the RFC's mRNA and protein expression after exposure of MTX to evaluate the RFC's role for the intracellular transport of MTX. In the Saos-2 cells, it was identified that the greatly reduced cytotoxic activity of MTX is associated with the lower level of RFC mRNA transcript, as compared with the basal level of RFC. In contrast, the expressed level of the RFC mRNA transcript in the AGS cells was increased after MTX treatment. In the [3H]-MTX uptake experiment, accumulation of [3H]-MTX in the AGS and Saos-2 cells was gradually impaired as compared to that of the control cells. These results suggested that reduced [3H]-MTX accumulation in the AGS and Saos-2 cells might be associated with the expression level of the RFC as a folate transporter. The RFC gene encodes the membrane carrier that's responsible for folate uptake, a carrier that is also used by antifolates, including MTX, to gain entry into cells. The decreased RFC level may lead to a less efficient intracellular transport of MTX with consequently decreased cytotoxicity (3). Our results showed that the MTX resistance was mostly associated with a decreased expression of the RFC gene.
The increased DHFR expression level is known to be the most important mechanism responsible for the resistance to MTX (3). In mammalian cell lines, acquired resistance to MTX occurs through a variety of mechanism such as genetic mutation that produces DHFR protein with a decreased affinity to MTX as well as the overexpression of DHFR protein by amplification of the DHFR gene (6). In this study, the DHFR mRNA and protein expression increased in the Saos-2 cells after MTX treatment. These findings suggested that an increase of the DHFR expression was closely associated with the development of MTX resistance in the MTX-resistant cell lines. In contrast to the results with the Saos-2 cell, a decrease of the DHFR mRNA expression was present in MTX-sensitive AGS cells after MTX treatment. The MTX resistance in the AGS cell line was mainly associated with a decrease of the intracellular mRNA levels of DHFR.
In the absence of MTX, the DHFR protein readily traversed the translocation protein channels in the mitochondria and the degradation protein channels in the proteasome, whereas addition of MTX markedly slowed the rate of both the mitochondrial import and the proteasomal degradation of DHFR protein. These observations suggest that MTX increases the mechanical stability of DHFR protein (19,20).
We analyzed the genotype of the novel and known polymorphisms in the DHFR. A different genotype of the RFC and DHFR was found between the MTX-sensitive AGS cells and the MTX-resistant Saos-2 cells. These results suggest that the differences in the expressions of the mRNA transcript and protein of the RFC and DHFR between the AGS and Saos-2 cell lines were associated with the variants of the DHFR.
In the Caucasian population, there were several variants of the DHFR, including a 9-bp repeat in the 5' UTR that affects mRNA stability or its translation efficiency. A 19-bp deletion in the highly conserved intron and only a few variant such as a 9-bp repeat in exon 1 of the DNA repair gene mutS homolog3 were detected in Japanese subjects (1,21,22). The DHFR gene is the most important target for determining the activity of MTX, and the concentration of MTX required to achieve effective inhibition of DHFR enzymatic activity is strictly dependent on the intracellular levels of this enzyme. Like other cell cycle-related genes, the expression of the DHFR is negatively regulated by the RB1 gene, via E2F, and so RB1 could influence the cellular sensitivity to drugs that target the DHFR (3).
Our novel SNPs were located in the promoter and exon regions and they affected the DHFR gene expression through interaction with the RB1. Unfortunately, no functional variants were available to support its effect at the DHFR expression level, and this warrants further investigation. Our study suggests that the evaluation of other genetic factors involved in the metabolic process of MTX resistance, as well as the RFC and DHFR, may also be useful for understanding the resistant to MTX. In this study, we determined the cytotoxicity of MTX in six cancer cell lines, yet the number of cell lines in this study was limited and further studies will be necessary to establish the cytotoxic effects of MTX. In our study, the clinical impact of the RFC as a predictive marker and the DHFR were not assessed in the tumor samples. Ongoing studies may also lead to the identification of new candidates as prognostic or therapeutic markers since the RFC and/or DHFR as well as other regulated genes represent an attractive target for the purpose of treating cancer.
Conclusion
Our findings suggested that the inverse change of the RFC and DHFR mRNA and protein expressions in the AGS and Saos-2 cells might be associated with polymorphisms of the RFC and DHFR. Although these preliminary findings need further confirmation, it is postulated that this phenomenon might play an important role in the sensitivity to certain cancers to MTX.


