Introduction
Lung cancer is the leading cause of cancer-related deaths worldwide. Small cell lung cancer (SCLC) represents 15-20% of all lung cancers [1]. Despite the use of more active and intensive regimens, the survival time of SCLC patients has shown only modest improvement over the past two decades due to the aggressive nature of the disease [2].
SCLC is divided into two stages: limited disease (LD), disease confined to one hemithorax, which can be encompassed in a tolerable radiation field, and extensive disease (ED), which includes spread of the tumor beyond these manifestations [3]. Currently, tumor stage is the most important prognostic factor in SCLC: other prognostic factors include performance status, weight loss, sex, serum albumin, and serum lactate dehydrogenase (LDH) levels [4, 5]. Despite its practical usefulness and prognostic advantages, the two-stage system is not accurate enough to reflect tumor burden and is inadequate for predicting survival in some patients. Therefore, prognostic factors with greater discriminatory power are needed for stratification of risk groups with the goal of developing individualized therapeutic strategies.
Positron emission tomography (PET) or fused positron emission tomography/computed tomography (PET/CT) imaging using the tracer 18F-fludrodeoxyglucose (18F-FDG) has been established as a standard technique for staging various cancers, including lung cancer. The degree of tumor uptake of 18F-FDG on PET/CT, as measured based on standardized uptake value (SUV), was recently shown to be an important prognostic factor in lung cancer and other malignant tumors [6, 7, 8, 9]. However, it remains uncertain whether 18F-FDG PET/CT can provide prognostic information for patients with SCLC. To date, only a few studies have addressed the prognostic role of 18F-FDG uptake in patients with SCLC [10,11].
In the current study, we investigated the prognostic value of metabolic parameters of pretreatment 18F-FDG PET/CT in patients with SCLC.
Materials and Methods
1. Patients
We retrospectively reviewed the tumor registry at our institution and identified all patients diagnosed with SCLC between January 2005 and February 2012. Patients who met the following inclusion criteria were selected for the current study: 1) histologically or cytologically confirmed diagnosis of primary SCLC; 2) pretreatment 18F-FDG PET/CT scanning; 3) adequate clinical data recorded in medical charts; and 4) treatment with at least one cycle of chemotherapy. Finally, we enrolled 114 consecutive patients. This study was approved by the institutional review board of our institution.
2. Treatment and response evaluation
Patients underwent combined chemotherapy with etoposide, cisplatin (EP) or irinotecan, cisplatin (IP) regimen as the first-line treatment. The EP regimen consisted of etoposide 120 mg/m2 on days 1-3 and cisplatin 60 mg/m2 on day 1. The IP regimen consisted of irinotecan 60 mg/m2 on days 1, 8, and 15 and cisplatin 60 mg/m2 on day 1. Both regimens were repeated with an interval of three weeks.
The Response Evaluation Criteria in Solid Tumor ver. 1.1 (RECIST 1.1) was used in assessment of the treatment response via a CT scan acquired every two or three cycles; the responses were classified as complete response (CR), partial response (PR), stable disease (SD), or progressive disease (PD). Objective response included both CR and PR.
3. 18F-FDG PET/CT imaging
18F-FDG PET/CT imaging was performed using a dedicated PET/CT scanner (Gemini, Philips, Milpitas, CA) consisting of a dedicated germanium oxyorthosilicate full-ring PET scanner and a dual slice helical CT scanner. Standard patient preparation included at least 8 hours of fasting and a serum glucose level of less than 140 mg/dL before administration of 18F-FDG. Two experienced nuclear medicine physicians who were unaware of the patients' clinical information were responsible for reading the 18F-FDG PET/CT images. The maximal SUV (SUVmax) was used quantitatively for determination of FDG PET activity. SUVmax was defined as the peak SUV in one pixel with the highest counts within the region of interest. The highest SUVmax of the primary lesion (primary SUVmax), calculated as the mean of the highest SUVmax values of malignant lesion for each organ (mean SUVmax), and the sum of the highest SUVmax values of malignant lesion for each organ (SUVsum) were selected as PET/CT parameters.
4. Statistical analysis
Overall survival (OS) and progression-free survival (PFS) were chosen as endpoints for evaluation of the prognostic value of 18F-FDG PET/CT. OS was defined as the time interval from the date of 18F-FDG PET/CT scanning to the date of death from any cause, or last follow-up. PFS was defined as the time interval from the date of 18F-FDG PET/CT scanning to the date of first progression or death from any cause without previous progression. The Kaplan-Meier method was used for estimation of survival time and the log-rank test was used for assessment of difference in survival between groups The Cox proportional hazards model was used for multivariate analysis of survival. Probability values <0.05 were considered statistically significant. SPSS ver. 18.0 (SPSS Inc., Chicago, IL) was used for statistical analyses.
Results
1. Patient characteristics
A total of 114 eligible patients were enrolled in the study. A summary of the patients' baseline characteristics is shown in Table 1. The median age of the patients was 67 years (range, 41 to 86 years) and 105 (92.1%) patients were male. The median number of cycles of chemotherapy was six (range, 1 to 12). Follow-up data were available through August 2012. At the time of analysis, 15 (13.2%) patients were still alive, with a median follow-up period of 10.5 months (range, 1.2 to 43.9 months). The estimated median OS and PFS for the entire cohort was 10.6 months (95% confidence interval [CI], 8.4 to 12.8 months) and 6.6 months (95% CI, 5.5 to 7.7 months), respectively.
2. SUV and survival
Tumors were detected by 18F-FDG PET/CT scanning in all patients. The median number of target organs per patient that showed metabolic activity was three (range, 1 to 8).
Three variables based on the SUVmax were evaluated: SUVsum (median, 24.6; 95% CI, 35.4 to 53.7), mean SUVmax (median, 6.4; 95% CI, 6.7 to 7.9), and primary SUVmax (median, 8.3; 95% CI, 8.3 to 9.9). The study population was divided into two groups according to a median SUVsum of 24.6. A list of descriptive statistics for the two groups is shown in Table 1. Patients with high SUVsumwere more likely to have higher levels of neuron-specific enolase (NSE) (p=0.010) and CYFRA 21-1 (p=0.014) and to have ED status (p=0.007) compared to patients with low SUVsum (Table 1). The patients were also divided into two groups based on the median primary SUVmax and mean SUVmax; however, no significant difference was observed between these two groups (data not shown).
The high-SUVsum group showed significantly shorter median OS (6.6 months vs. 13.0 months, p<0.001) and PFS (5.2 months vs. 8.0 months, p<0.001) than the low-SUVsum group (Fig. 1). Results of univariate analysis of OS showed that sex, performance status, primary SUVmax, and mean SUVmax were not significant predictors of OS, whereas SUVsum, age, LDH, NSE, CYFRA 21-1 levels, tumor stage, chemotherapy cycles, and response to first-line treatment were significant predictors of OS. In multivariate analysis, SUVsum, age, chemotherapy cycles, and response to first-line treatment remained significant predictors of OS (Table 2).
A result similar to that observed for OS was obtained for the association between PFS and these factors. Results of univariate analysis showed that age, performance status, primary SUVmax, and mean SUVmax were not significant predictors of PFS, whereas SUVsum, sex, tumor stage, chemotherapy cycles, and response to first-line treatment were significant predictors of PFS. Results of multivariate analysis showed that SUVsum, sex, chemotherapy cycles, and response to first-line treatment were independent predictors of PFS (Table 2).
3. Subgroup analysis according to disease stage
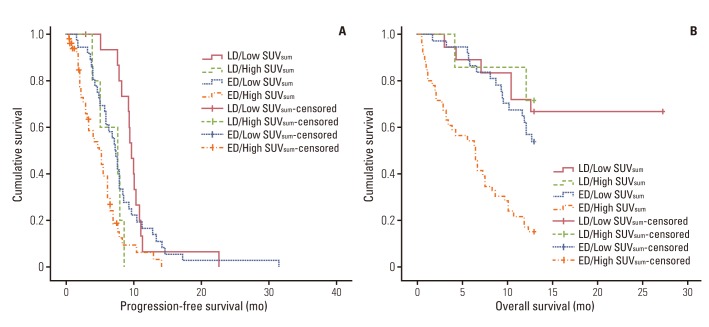
A strong association between SUVsum and PFS was also found within each disease stage. Patients with LD and high SUVsum (n=7) showed a significantly shorter median PFS (7.7 months vs. 9.8 months, p=0.001) than patients with LD and low SUVsum (n=19) (Fig. 2A). Patients with ED and high SUVsum (n=50) also had a significantly shorter median PFS (5.0 months vs. 7.4 months, p=0.002) than patients with the same stage and low SUVsum (n=38) (Fig. 2A). Similar results were obtained regarding OS. Patients with ED and high SUVsum showed a significantly shorter median OS (6.6 months vs. 11.0 months, p<0.001) than patients with ED and low SUVsum (Fig. 2B). However, no significant association between OS and SUVsum was observed in patients with LD (p=0.703) (Fig. 2B). Of particular interest, patients with LD and high SUVsum had similar median OS (11.7 months vs. 11.0 months, p=0.602) and PFS (7.7 months vs. 7.4 months, p=0.537) compared to patients with ED and low SUVsum (Fig. 2).
4. SUV and response to first-line treatment
Table 3 shows the distribution of the best responses to first-line treatment. A total of 114 patients received chemotherapy and 91 patients were evaluated. An objective response rate was achieved in 41.2% of all treated patients. Regarding the objective responses to treatment, a significant difference was observed between the high-SUVsum group and the low-SUVsum group (19.0% vs. 40.8%, p=0.025).
Discussion
Results of this study showed a strong association of SUVsum, the sum of the SUVmax values of 18F-FDG PET/CT, with survival in SCLC. Patients with low pretreatment SUVsum had significantly longer OS and PFS. In contrast, mean SUVmax and primary SUVmax were not significant predictors of OS and PFS inpatients with SCLC.
18F-FDG PET/CT has become an essential imaging tool for management of lung cancer. SUV is the PET parameter most commonly used as a semiquantitative index of 18F-FDG PET/CT. This parameter reflects tumor glucose metabolism and is represented by the mean (SUVmean) value or by the maximum (SUVmax) value [12]. Previous studies have suggested an association between SUVmax and tumor aggressiveness [7,10,13]. However, measurement of SUVmax was confined to detection of the most evident metabolic activity of the tumor at a single site, and not of the overall tumor activity. In general, SCLC shows a rapid doubling time, a high growth fraction, and early development of widespread metastases [14]. Therefore, SUVmax at a single site or the mean value of SUVmax is not sufficiently accurate to reflect real tumor metabolic activity in an aggressive cancer, such as SCLC. In the current study, in order to compensate for this shortcoming, SUVsum was used as an indicator that potentially reflects the overall tumor metabolic burden of the entire body.
The results obtained here are consistent with those of Zhu et al. [11], who reported that metabolic tumor volume (MTV), a volumetric parameter of 18F-FDG PET/CT, is an important independent prognostic factor in patients with SCLC. MTV represents the amount of highly metabolic tumor cells [11]. There is a thread of connections showing that the parameters reflecting the entire tumor metabolic burden, such as SUVsum or MTV, are more effective predictors of survival in patients with SCLC than SUVmax at a single site or mean SUVmax. However, calculation of MTV is more complicated than that of SUVsum because it generally requires use of additional commercial software. Thus, we cautiously suggest that clinicians should focus on the sum of SUVmax value rather than on measurement of MTV in all target lesions, an approach that might be helpful in avoidance of an unnecessary overburden in the practice of nuclear medicine specialists.
Park et al. [15] reported a significant association of baseline SUVsum with survival in patients with diffuse large B-cell lymphoma (DLBCL). DLBCL is an aggressive tumor, which can arise in virtually any part of the body, like SCLC [16]. Similar to our result, metabolic burden represented by SUVsum from baseline 18F-FDG PET/CT was predictive of clinical outcome in patients with these aggressive tumors.
Results of our study showed that chemotherapy cycles and response to first-line treatment were good prognostic factors in SCLC. Because SCLC is extremely sensitive to chemotherapy, systemic chemotherapy is the main treatment strategy [14]. In this study, patients receiving chemotherapy more than three times had a significantly longer median OS and PFS than patients receiving chemotherapy once or twice (13.0 months vs. 4.3 months, p<0.001 and 7.7 months vs. 2.2 months, p<0.001, respectively). In addition, patients exhibiting CR or PR after the first treatment showed significantly longer median OS and PFS than patients exhibiting SD or PD (12.2 months and 9.7 months, p=0.001 and 7.0 months and 3.8 months, p<0.001, respectively). Historically, in many malignancies, including lung cancer, measurement of objective response has been an effective tool for prediction of OS [17,18,19,20]. Patients who did not enter CR or PR after two or three cycles of chemotherapy showed poor outcomes. Our findings may reflect the clinical importance of early switching of the chemotherapy regimen in patients who show poor response to first-line treatment. The results of a Japanese clinical trial indicated the benefit of an early switch from etoposide to irinotecan [21]. All of these findings indicate the need for development of new therapeutic strategies for patients without early tumor regression in order to improve their poor prognosis.
We recognize several limitations of this study. First, it was a retrospective review over a long period, which included a heterogeneous cohort and treatment protocols. However, this is unlikely to have had an impact on our results, because several studies have demonstrated thatthe prognosis of SCLC does not change significantly during and beyond the study period [2]. Second, in our study, tumor stage did not significantly predict survival. Only some of our patients with LD underwent concurrent thoracic radiation therapy, for various reasons. Early concurrent thoracic radiation therapy is known to improve OS and PFS in patients with LD [22]. This might explain our inability to find statistical significance regarding tumor stage in prediction of OS and PFS in our study population.
Conclusion
The current treatment strategy based on the stage of the disease is not completely satisfactory SCLC, and development of novel therapeutic approaches based on precise risk stratification is challenging. In this study, metabolic burden represented by SUVsum from baseline 18F-FDG PET/CT was an important independent prognostic factor in patients with SCLC. We suggest that SUVsum combined with tumor stage can more precisely predict clinical outcome in patients with SCLC.