Introduction
Gliomas are the most common primary malignant tumor that originates in brain parenchyma. Gliomas that have arisen from glial cells are classified according to their cell types, astrocytomas, oligodendrogliomas, or ependymomas. In distinction from other brain tumor types, diffuse gliomas exhibit high infiltrative nature into the surrounding nerve tissue [1].
Previous classification of brain tumor was primarily based on histopathological features that confirmed to hematoxylin and eosin staining, immunohistochemistry (IHC) and others. However, recent reclassification of tumors of the central nervous systems (CNS) by World Health Organization (WHO) considered not only histological and pathological characteristics, but also molecular parameters, reflecting heterogeneous genotypes of gliomas. The most notable changes regard to categorization of astrocytomas and oligodendrogliomas based on IDH1 mutation, ATRX loss, TP53 mutation and chromosomal deletion of 1p and 19q arms [2]. In the setting of unavailable molecular results, tumor types are designated as ‘NOS’ (not otherwise specified) [3]. As the reclassification of tumor entities necessitates assessment of molecular parameters in addition to histology, genetic evaluation has become an essential part in CNS tumor diagnosis. Next-generation sequencing (NGS) technology facilitates comprehensive analysis of genomic profiles that constitute human genome in a massively paralleled method. A substantial body of evidence has shown its capability in accurately capturing and identifying multiple genetic alterations, including single nucleotide variation (SNV), insertions and deletions, copy number variation (CNV), and structure variations (SV) [4]. In spite of such prevalent use, whole exome sequencing (WES) or whole-genome sequencing often demands high expense, requiring strenuous efforts in generating large-scale datasets for comprehensive analyses [4].
On the contrary, targeted sequencing provides an alternative avenue in addressing potential challenges as its implementation has become more prevalent in clinical use as Foundation ONE CDx (https://www.foundationmedicine.com) and MSKCC (https://www.mskcc.org). Furthermore, genomic and molecular characterization of tumors enables optimal patient-tailored therapy. Toward this goal, we have designed and developed targeted NGS panel, capable of detecting protein-coding mutations, selected promoter mutations, CNVs, and potential proto-oncogenic SVs, for accurate molecular diagnosis of diffuse gliomas. Furthermore, we also implemented sequencing of normal controls for each matched tumors, to accurately distinguish somatic variations from germline mutations. In this study, we present and validate the potential implementation of targeted sequencing panel, in hopes of providing more accurate guidance towards tumor diagnosis and clinical management.
Materials and Methods
1. Study design
Cancer patient samples were obtained at Samsung Medical Center from January 2014 to August 2017. A pathologist examined each sample for diagnosis and tumor content. The inclusion criteria for specimens in this study are (1) the possibility that the patient could be enrolled in a clinical trial if an actionable mutation is discovered; and (2) the patient’s specimen was stored the pathology department with a sufficient amount of tumor fraction. Samples were typically processed without a paired normal tissue.
2. Panel design and sequencing
Samples were sequenced by GliomaSCAN, a targeted sequencing panel designed at Samsung Medical Center. This customized panel was consisted 232 target genes covered variants associated with the targeted cancer therapies (1) approved by the Korean Ministry of Food and Drug Safety and U.S. Food and Drug Administration, (2) reported as having association with response of therapy in the public databases as Catalogue of Somatic Mutations in Cancer (COSMIC) and clinical trials of the literature. The target genes are listed in S1 Table.
3. Analytical validation
There kind of reference materials as HD753 (Horizon Inc., Cambridge, UK), NA12878, and pooled set from 10 cell lines (NA07014, NA10840, NA18488, NA18511, NA18595, NA18867, NA18924, NA18957, NA19108, and NA19114) were used to estimate a panel performance as sensitivity, specificity, limit of detection (LOD), positive predictive value (PPV), and negative predictive value (NPV). Sequencing quality of pooled set and distribution of variant allele frequency were listed in S2 and S3 Tables. In case of HD753, sensitivity was calculated after compared of identified variants and variant allelic frequency (VAF) in the panel with expected value for SNV, insertion, and deletion (InDel), and CNV. In case of NA12878, to calculate sensitivity, specificity, PPV and NPV, the genotype of SNVs in the panel was compared with NA12878 within coding region. In addition, to estimate LOD and sensitivity, the measured VAF of SNVs in the panel was compared with expected VAF in pooled set.
4. Comparison by whole exome sequencing
1) Patient sample information and DNA extraction for cross-validation
This study was accepted by the institutional review board at Samsung Medical Center. Surgical specimens and clinical information were obtained from brain tumor patients who underwent tumor removal surgery at these institutions. Informed consents were obtained from all patients. Histologic diagnoses of tumors were made by the independent pathologists (S4 Table). For genomic analysis, parts of the tumor specimens were snap-frozen and preserved in liquid nitrogen until use. Genomic DNA was extracted using the DNeasy kit (Qiagen, Valencia, CA). We performed targeted sequencing in 46 samples. Among these cohorts, 28 samples were simultaneously subjected for WES. The study that designed to confirm chromosome 1p and 19q status was performed using 51 samples and 45 samples, WES and targeted sequencing, respectively [5].
2) Somatic mutation
The sequenced reads in FASTQ files were mapped on the human genome assembly (hg19) using Burrows-Wheeler Aligner ver. 0.6.2 [6] or mutation calling, MuTect [7] and SomaticIndelDetector [8] were used to make high-confidence predictions on somatic mutations from the tumor and normal tissue pair. Variant Effect Predictor (VEP) version [9] was used to annotate the predicted somatic mutations with potential functional consequences and other relevant information. We selected significant mutations based on the following criteria: (1) total reads ≥ 20, (2) VAF ≥ 0.05.
5. Statistical analysis
VAF correlation between WES and targeted sequencing was calculated by Pearson. To evaluate 1p/19q status using targeted sequencing, copy number status of the genes located in chromosome 1p and 19q were employed and interrogated using the receiver operating characteristic (ROC) curve and measured with trapezoids [10,11]. For visualize alterations, we used Oncoprint plot by R package and Complex Heatmap (Heidelberg, Germany) [12]. To compare somatic mutation of IDH1 and focal amplification of EGFR between GliomaSCAN and fluorescence in situ hybridization (FISH) or IHC, two-sided Fisher exact test was used.
Results
1. Analytical validation
1) Horizon HD753
Total of 15 variants from all 18 variants were chosen by covered target region in GliomaSCAN. When 15 variants, including three SNVs, two SNV high GC, one SNV low GC, one long insertion, one long deletion, and three short deletion were compared with the identified variants from our panel, all variants were detected (S5 Table). The comparison of allelic frequency in both expected and measured variants showed high correlation (r2=0.9356) (S6 Fig.). As a result, sensitivities of SNV, InDel, CNV were measured at 100%.
2) NA12878 reference material
To estimate sensitivity and specificity of SNV for 4,330 target coding regions (1,269 kb) in our cancer panel, fully genotyped and validated gold standard (NA12878 cell line) [13] was used. When we compared the identified SNVs in our panel with NA12878 genotypes (ftp://ftp-trace.ncbi.nlm.nih.gov/giab/ftp/release/NA12878_HG001/latest/GRCh37/), all identified SNVs were perfectly matched to the true genotypes (S7 Table). In addition, 846,058 reference genotypes in the target regions were matched with the genotypes that were identified in our panel. The specificity and sensitivity were measured at 100% (S5 Table).
3) Pooled set
Subsequently, LOD and detection sensitivity were measured using the pooled set (expected VAF range, 4% to 100%; number of variants in answer set, 689). When we evaluated the SNVs that were identified in our panel, the sensitivity and correlation ratio (r2) were measured at 99.2% and 0.9856, respectively (S8 Fig.). S8 Fig. demonstrates the comparison results of the expected VAF with the observed VAF in our panel. In a range of low expected VAF (4.1%-5%), 135 of 136 variants were detected (99.3%), suggesting the LOD is greater than 5%.
2. Comparison of variant allele frequency between targeted sequencing panel and WES
To ensure the accuracy of our targeted sequencing panel, we compared the variant allele frequency of somatic mutations that were acquired from our targeted panel to WES. Extracted DNA from normal blood and matched tumor tissue specimens of 28 patients were subjected to both WES and targeted sequencing panel. Thresholds of significant mutations from SNV, insertion or deletion were set to depth coverage ≥ 20 and VAF ≥ 5%.
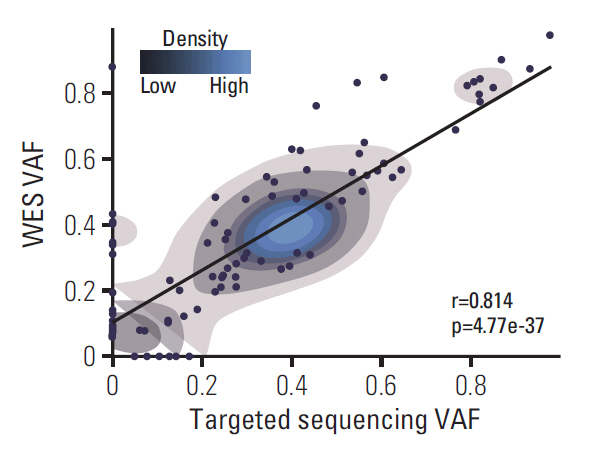
We compared the VAF of all somatic mutations that were generated from WES and targeted sequencing (Fig. 1, S6 and S9 Figs.). A total of 118 genomic alterations were detected from both sequencing panels and 24 or nine alterations were detected only from WES or targeted sequencing, respectively. We speculated that private mutations with relatively low VAF were due to extensive intra-tumoral heterogeneity of glioblastoma (GBM) as the DNA samples that were subjected for targeted sequencing panel has been derived from different region of the same tumor compared to the tumor fragment that were subjected to WES. From low VAF, we inferred presence of sub-clonal mutations as when tumor cells proliferate, they acquire diverse sets of private mutations under selective pressure [14]. On the contrary, we also detected a small number of private mutations with relatively high VAF that were specific only to the WES platform. When we closely scrutinized each private mutation call, we discovered that these genomic variations have been filtered out from the targeted sequencing panel as they were simultaneously detected from the matched normal blood, suggesting that these are actual germline mutations (S10 Fig.). Their absence from the WES blood panel was largely attributed to significant difference in sequencing depth between WES and targeted sequencing panels.
Coverage of GliomaSCAN is measured at approximately 800×, which is much higher than that of standard WES, which is 200×. Nevertheless, WES and targeted sequencing panels demonstrated high correlation in terms of somatic mutational frequency (r=0.814, p=4.77e-37, Fisher exact test). Our results collectively suggest that the targeted sequencing panel could accurately identify and generate potential somatic variations compared to the previously established WES platform at a high-confidence level.
3. Overview of clinically actionable somatic mutation profiles
One of the main purposes of targeted sequencing is to identify somatic variants that can be translated into the clinic, such as ‘actionable mutations.’ Actionable mutations are defined as molecular targets for new drugs as well as existing drugs [15]. We systematically evaluated clinical utility of actionable mutations across 94 genes that were determined as potentially actionable variants and could guide treatment decisions [16]. Interestingly, 32 of 46 patients (69.6%) possessed at least one somatic mutation in clinically actionable gene, indicating that these patients have specific molecular targeting drugs that can predict therapeutic response within the clinic [17]. In addition, 11 of 46 patients (23.9%) harbored previously reported Catalogue Of Somatic Mutations In Cancer (COSMIC) variants. Mutations in NF1 were the most prevalent actionable variants (31.3%), followed by PTEN, PIK3CA, and PTPN11 mutations (28.1%, 15.6%, and 12.5% respectively). Furthermore mutations from 19 genes were found recurrently in at least two or more patients (Fig. 2). The number of somatic mutations from recurrently mutated genes varied from 2 to 81 among 32 samples (1.5 mutations per sample). Our results indicate that 93.5% of the patients (43 of 46 patients) had at least one genetic alteration that could be potentially employed as a predictable marker of therapeutic response.
4. Somatic genomic landscape of recurrent mutations in diffuse gliomas
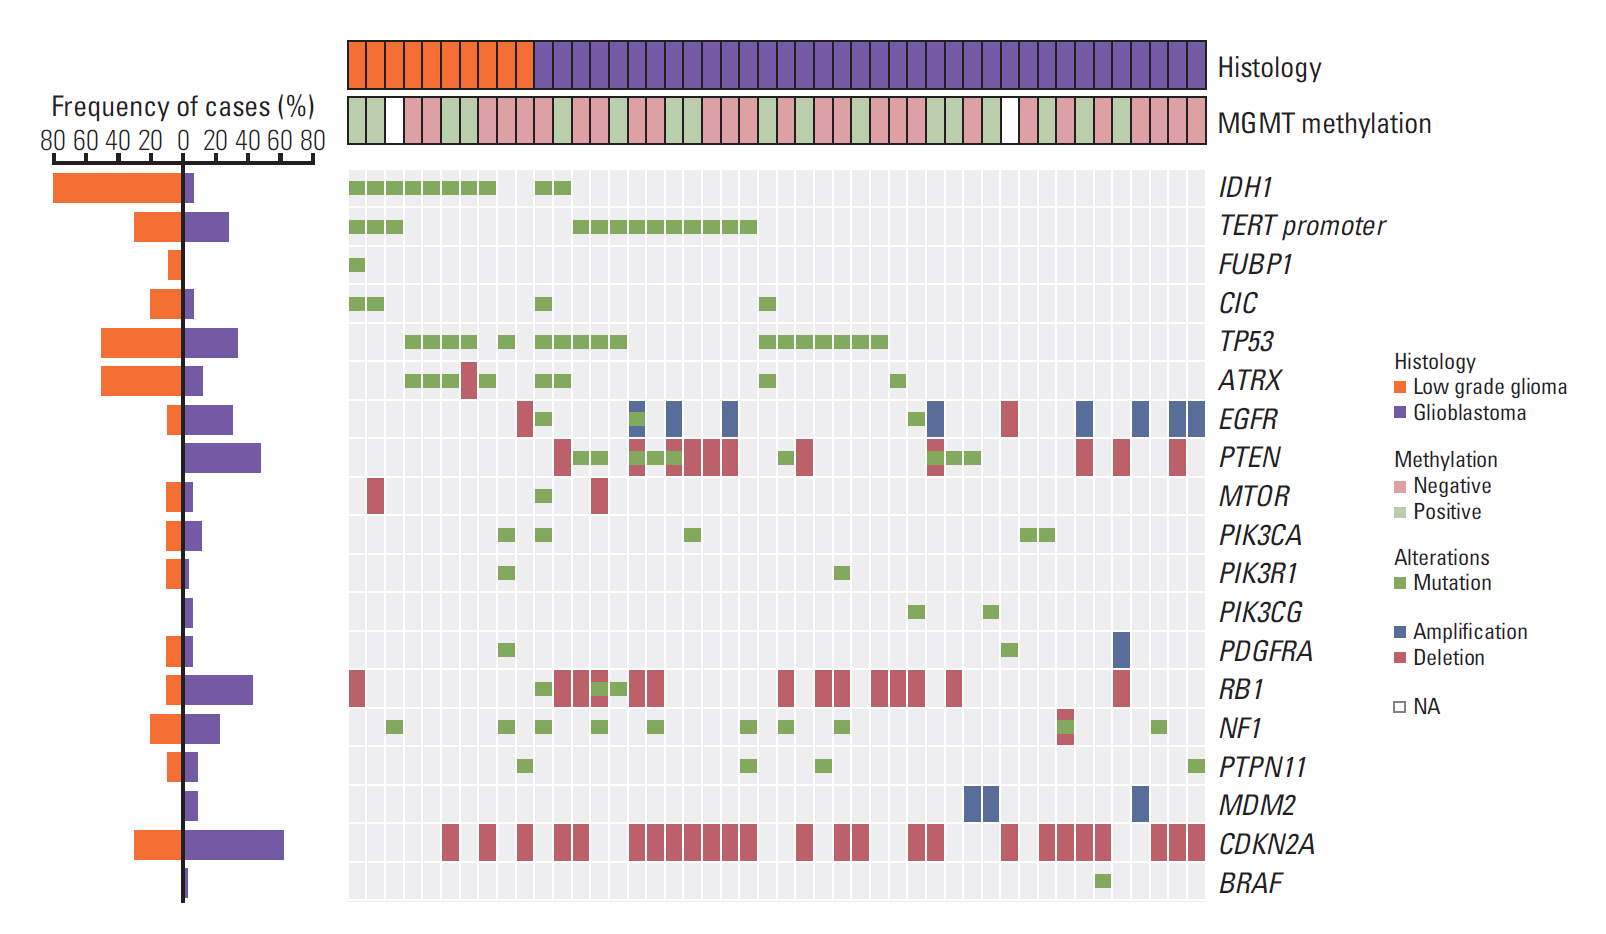
Using targeted sequencing panel, we analyzed mutational landscape of recurrent mutations that are frequently involved in glioma propagation [18]. We evaluated SNVs, short insertions and deletions in 16 genes from 46 tumors containing low-grade gliomas (LGG) and GBM, 10 and 36 cases, respectively. It is certainly necessary to recognize recurrent alterations in gliomas as these genomic alterations regulate core oncogenic pathways that are frequently dysregulated in GBM. Previous studies have shown that TP53 mutation occurs at an early stage of the tumor evolution across multiple tumor types [19]. The WHO reclassification not only considers mutation of IDH1/IDH2, but also TP53 or alpha-thalassemia X-linked mental retardation (ATRX) for glioma diagnosis [20,21]. Furthermore, co-deletion of chromosome 1p and 19q arms do not coincide with TP53 mutations [21]. TP53 alteration is also significantly associated with secondary GBM and dictate therapeutic response to current standard therapy [20,22]. Also, the ATRX status is a critical marker that histologically and genetically defines the classification in gliomas. ATRX mutation has been mostly reported in astrocytomas accompanied by TP53 alteration [3].
In addition, GBMs can be classified into 4 distinct molecular subtypes based on transcriptome expression and accompanying genomic alterations. Molecular subtypes could be also categorized based on copy number alterations (CNAs) and somatic alterations of cancer-driver genes such as EGFR, NF1, and PDGFRA. Recurrent mutations within these genes differ considerably between molecular subtypes with distinct biological characteristic [23].
We observed prevalence of CNA in 11 genes (TP53, ATRX, EGFR, PTEN, MTOR, PDGFRA, RB1, NF1, MDM2, CDKN2A, and BRAF). Several genomic alterations, including focal amplification of EGFR and genomic deletion of PTEN were only identified in GBM tumors, consistent with previous notions that chromosomal gain of 7 and deletion of 10 are the major tumor initiating events in GBM, while IDH1 and ATRX mutations were significantly more frequent in LGG, 8 and 4 out of 10 tumors, respectively. Majority of the IDH mutations were R132H except for one case (IDH1 R20*; gained stop codon) (Fig. 3).
5. Identification and validation of prognostic and diagnostic molecular markers of diffuse gliomas in targeted sequencing panel
Somatic mutation of IDH1/2, genomic amplification of EGFR, co-deletions of chromosome 1p and 19q arms are the most significant prognostic and diagnostic biomarkers to classify diffuse gliomas. IDH1/2 mutations have been mainly reported in LGGs and secondary GBMs and associated with long-term survival. The focal amplification in EGFR is identified in about 50% of GBMs. Because EGFR amplification was known to promote cell proliferation, clinical trials for EGFR inhibitors were frequently conducted [24]. Somatic mutation of IDH1 and focal amplification of EGFR, which are considered as important contributors in glioma propagation have been commonly detected using IHC and FISH for pathological diagnosis. IHC is less sensitive than DNA sequencing technique. Despite its lower sensitivity, IHC has been used as a standard method for detecting IDH1 mutations because it is relatively inexpensive and can be measured promptly. To evaluate clinical feasibility of GliomaSCAN, we compared our targeted sequencing data to the current standard methods. EGFR amplification status obtained by our targeted sequencing highly corresponded with independent FISH results (p=2.06e-04, Fisher exact test) (Table 1). The detection rate of IDH1 mutational status by GliomaSCAN demonstrated high concordance rate compared to conventional IHC method, the current standard measurement of detecting IDH1 mutation in gliomas in the field of neuropathology (p=6.68e-07, Fisher exact test) (Table 1).
Oligodendrogliomas and astrocytomas exhibit substantially different chromosomal status of 1p/19q, particularly [3]. 1p/19q co-deletion is closely associated with oligodendroglial components in gliomas [21]. Furthermore, the previous study has shown that co-deletion of 1p/19q potentially influence therapeutic response to alkylating agents such as temozolomide [25] as patients with 1p/19q co-deletion showed significant clinical response compared to those without the 1p/19q co-deletion [26]. Therefore, we evaluated the presence of 1p/19q co-deletion using our targeted sequencing panel. We selected 20 genes that were located on chromosome arms of 1p and 19q for predicting 1p/19q co-deletion status. To evaluate whether our proposed gene-set could reflect actual chromosomal co-deletion status, we compared the segmented chromosomal level of 1p and 19q using WES. When nine out of 11 genes and eight out of nine genes from chromosome arms of 1p and 19q, respectively, were simultaneously deleted, we observed chromosomal level deletion of 1p and 19q in each corresponding tumor. The ROC curve was applied using 51 samples to evaluate the accuracy of our selected genes as a biomarker for identifying 1p/19q co-deletion status. When we integrated our gene-set and WES results, our proposed genes demonstrated high predictability rate to the chromosomal co-deletions of 1p and 19q (area under the curve [AUC], 0.929; 95% confidence interval [CI], 0.886 to 1) (Fig. 4A).
We further evaluated whether our targeted sequencing panel could predict accurate 1p/19q co-deletion status compared to the previously well-established diagnostic method such as FISH. Consistently, our panel demonstrated high concordance rate based on ROC curve analysis (AUC, 0.917; 95% CI, 0.860 to 0.974) (Fig. 4B). We compared 1p/19q codeletions and amplifications of 7p/deletions of 10q that were derived from WES with our predicted chromosomal deletion from targeted sequencing panel. Notably, both panels showed much similar chromosomal profiles (Fig. 4C, S11 Fig.). Recent studies recommend that chromosome 7p gain /10q loss as well as chromosome 1p/19q co-deletion should be considered in the glioma classification. Gain of chromosome 7p and loss of chromosome 10q are recurrently occurred in IDH wild-type GBMs. Also, the progression of gliomas has been regulated by activation of genes in chromosome 7p such as EGFR and inactivation of genes in chromosome 10q such as PTEN [27].
Overall, our results show that targeted sequencing panel could accurately identify the focal copy number variants of chromosome, which is an essential prognostic feature in glioma diagnosis.
Discussion
Gliomas that comprise the majority of the malignant brain tumors are originated from three types of glial cells. Because gliomas consist of mixed glial cell types, tumors often demonstrate different histopathological and genomic features [28]. Recent reclassification of glioma diagnosis necessitated assessment of molecular parameters, including somatic mutation of IDH, ATRX, and TP53, and chromosomal deletion of 1p and 19q arms [3]. Therefore, comprehensive understanding of genomic features and its clinical significance and impact have been highlighted in tumor diagnosis and treatment. In order to evaluate and identify such molecular aberrations, different methodological approaches, including IHC or FISH have been applied as golden standards in clinical diagnosis fields. However, such techniques were limited by the number of hot-spot genomic variations that could be identified and demands extensive expense and resource [29]. Furthermore, the resulting analyses required at least two or more independent and random neuropathologists to account for inter-observer variability.
NGS can complement tumor diagnosis via identification of actionable proto-oncogenes or dysfunction of tumor suppressor genes which contribute to tumorigenesis. Several targeted sequencing panels have been established and refined to examine a wide array of molecular aberrations that are frequently detected across pan-cancer models [30]. However, gliomas exhibit a distinctive set of genomic traits that are highly specific to gliomagenesis, necessitating development of a glioma-specific target sequencing panel. As such, we have designed and generated a custom panel, encompassing 232 essential gliomagenesis-associated genes. GliomaSCAN presents essential manifestations to facilitate accurate diagnose within glioma subgroups and establishes foundation for potential genome-guided precision oncology therapy.
In the present study, our goals were to validate sensitivity and specificity of our custom sequencing panel to capture essential molecular aberrations and to provide translational bridge towards potential clinical implication. We reported a direct comparison on somatic genomic landscape, measured by WES and GliomaSCAN, of 46 patients who were diagnosed with diffuse gliomas, as WES has emerged as a reliable platform for recognition of recurrent actionable alterations. Both tumor and matched blood samples were sequenced and compared to distinguish somatic variants from germline mutations. Somatic alterations that were identified by WES or GliomaSCAN have shown a significant correlation coefficiency. Furthermore, key diagnostic and prognostic molecular parameters, including somatic mutations in IDH, TP53, and ATRX, focal amplification of EGFR, and chromosomal co-deletion of 1p and 19q were successfully captured and showed minimal variations from conventional experimental methods such as IHC and FISH. Our results present significant recognitions as 1p and 19q co-deletion is an early genetic and pathologic event, which is essential in diagnosing oligodendrogliomas.
We not only identify alterations of chromosome levels, but also add target genes on unlimited the number of genes. When compared to previous glioma-targeted sequencing panels, our panel is more flexible because we can easily increase or modify target genes. These characteristics make it possible to rapidly reflect the results of clinical trials that are currently underway targeted anti-cancer drugs on our panel.
Collectively, targeted sequencing panels are the next step towards more accurate diagnosis of various disease entities and genome-guided personalized treatment. In such context, we anticipate that GliomaSCAN could enhance comprehensive understanding of molecular and genomic complexity of diffuse gliomas and provide essential components in making informed clinical decisions.