Introduction
Taxanes, notably paclitaxel (PTX) and docetaxel (DTX), are cytotoxic microtubule-stabilizing agents used in various types of cancers, including gynaecological cancers (ovarian, cervical, and endometrial cancer) and breast cancers, with proven survival benefits [1]. Intrinsic or acquired resistance (AR) to chemotherapy are major clinical obstacles, resulting in poor response and lower overall survival rates. Yet, there is no efficient predictive model for resistance due to its complexities. Drug resistance is a result of complex biochemical and molecular processes. Moreover, crosstalks between different signaling pathways adds an additional layer of intricacy. Identifying the genetic and pathway alterations for resistant tumor cells and predicting resistance using genomic data will be valuable in cancer research and clinical management.
To predict anti-cancer drug responses, recent large-scale pharmacogenomic projects, notably Cancer Cell Line Encyclopedia (CCLE) and Cancer Genome Project (CGP), published genomic data and dose responses for drugs across cancer cell lines. CCLE and CGP analyzed responses of over 1,000 cell lines to 24 anti-cancer drugs and over 700 cell lines to 138 drugs, respectively. Two studies tested over 400 cell lines and 15 drugs in common. One of the common drugs is PTX and CGP has additional DTX response data. Despite the pharmacogenomic significance in medical research, inconsistency between two studies has been controversial recently. A past study reported a discordance in measured pharmacologic drug response between CCLE and CGP and inconsistent correlation between genomic profile and drug response, potentially undermining researches based on the database [2]. Another study obtained fair statistical consistency by revised metrics but attributed PTX to the majority of inconsistent drug/cell line pairs [3]. Besides, drug resistance of cell lines in CCLE and CGP is known as intrinsic, posing a difficulty in modeling AR. Past studies on acquired taxane resistance (ATR) often individually investigated single cell lines and drug treatments, and the generalizability and transferability of their findings remain undetermined.
High-throughput technologies such as array and sequencing have drastically altered biological research. Since the high dimensionality of genomic features renders the conventional regression limited, analyzing large-scale bioinformatic data became particularly challenging. Standard statistical models require independent assumption, which is violated by the highly correlated nature of genomic features. Regularized machine learning such as penalized regression has been developed for high dimension data structures. Penalized regression with its versatility in data mining and machine learning quickly became one of the most widely used ensemble learning methods. The regression is highly data adaptive, suitable for high dimension low sample size data, and sensitive for interactions and correlations among features. In addition, penalized regression is more interpretable and hence advantageous than “black-box machine learning models,” especially in the field of medicine.
In this study, we developed and validated a highly accurate multi-study–derived, multivariable predictive model for ATR using personalized pathways and sophisticated machine learning algorithms.
Materials and Methods
1. Study selection
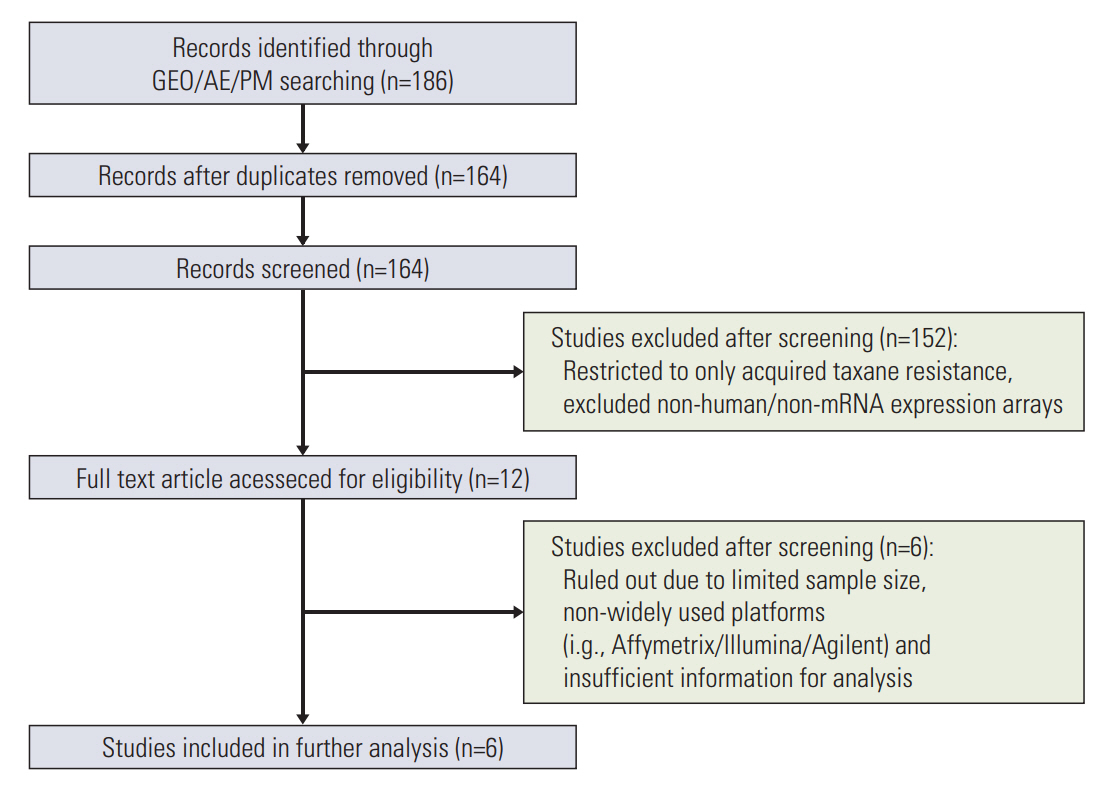
We searched for relevant articles on the PubMed and EMBASE using the following search term combinations: “(taxane OR taxoids OR paclitaxel OR docetaxel OR cabazitaxel) AND (drug resistance OR chemoresistance).” The gene expression datasets were screened and retrieved from NCBI's Gene Expression Omnibus (GEO, http://www.ncbi.nlm.nih.gov/geo/) or ArrayExpress (http://www.ebi.ac.uk/arrayexpress) at the European Bioinformatics Institute by the following query: “('taxane' [All Fields] OR 'taxoids' [MeSH Terms] OR AND 'drug resistance' [MeSH Terms]) AND expression profiling by array.” Studies with insufficient sample sizes, animal data and inadequate control groups were excluded. We only included samples that acquired taxane resistance via stepwise selection and the datasets from microarray platforms from Affymetrix GeneChip, Agilent one-color microarrays and Illumina BeadArray. These platforms are widely used with publicly available annotation information and more consistent in quality. The flow chart of study selection is in Fig. 1 and the selected study cohorts are summarized in Table 1.
2. Data processing
All data sets (GSE36135 [4], GSE28784 [5], GSE23779 [6], GSE12791 [7], GSE33455 [8], CCLE, and CGP) used in this study are publicly accessible from the GEO via National Center for Biotechnology Information (http://www.ncbi.nih.gov/geo) and ArrayExpress (http://www.ebi.ac.uk/arrayexpress) at the European Bioinformatics Institute, CCLE (http://www.broadinstitute.org/ccle/), and CGP (http://www.cancerrxgene.org/). Raw gene expression profiles for CCLE and CGP cell lines were publicly accessible from both the CCLE website and ArrayExpress under the accession number E-MTAB-783, respectively. For CCLE and CGP datasets, the resistant/sensitive phenotype to taxane were classified as follows: cell lines in the below median IC50 or area under curve (referred to as ActArea in CCLE) values were classified as sensitive and those above median IC50 or area under curve values were classified as resistance. Detailed step-by-step normalization methods and procedures have been documented previously [9]. Expression values from each data set were normalized and log-transformed. Raw data from Affymetrix platforms, if available, were preprocessed using Robust Multi-array Average (RMA) [10]. Otherwise, we used pre-processed data as provided by the original authors. To generate gene level summarization, we utilized an interquartile range (IQR) method. This allowed us to designate the probe set ID with the largest IQR of expression values out of all multiple probe set IDs as the representative of the gene. Missing expression values are designated using nearest neighbor imputation (R package impute) [11]. To achieve correct batch effect and cross-study normalization, ComBat, an empirical Bayes method, was applied [12].
3. Development of the algorithm
The pathway dysregulation scores (PDS) for each individual sample point were calculated using Pathifier algorithm which is designed to quantify the degree of pathway abnormality [13]. This method uses the algorithm by Hastie and Stuetzle to find a principal curve which is nonparametric, nonlinear generalization of the first principal component for dimension reduction [14].
Consider one-dimensional curve f which is a vector f(s) of n functions of a single parameter variable s in n−dimensional space. Given a finite n−dimensional random vector X=(X1, X2, ..., Xn), the projection index is defined as:
and the condition for self-consistency is simply f(v)=E(X|vf (X)=s). The PDS of sample i is defined as the distance along the curve between principal curve fi and a reference end point, defined as the centroid of control set of samples (i.e., sensitive cells). Every sample is analyzed in relation to this principal curve and PDSs are assigned using the normalized projection distance for each sample’s pathway. Pathway information used to design the PDS matrix was obtained from three curated pathway databases (the Kyoto Encyclopedia of Genes and Genomes, the BioCarta and the National Cancer Institute–Nature Pathway Interaction Database). Then we used regularized regression on these PDS matrices to fit the model. Regularization techniques have been described in detail in previous reviews [15,16]. The elastic net is a regularized regression method that linearly combines the penalties of the lasso and ridge regression methods and is defined as p α , λ ( β j ) = λ ( α | | β j | | 1 + ( 1 − α ) 1 2 | | β j | | 2 2 )
Elastic net is optimal for high dimension, low sample size (HDLSS) genomic data with highly correlated predictors because L1 reduces model complexity and L2 prevents oversimplifying. To make the multi-study–derived classifier, the leave-one-out cross validation (LOOCV) procedure, which is repeated N times (the total number of samples), is used to estimate the average standard error and identify an optimal value of the regularization parameter with minimum deviance. The efficient parameter selection via global optimization (EPSGO) algorithm was then used to further optimize the parameters [17]. EPSGO, based on learning an online Gaussian process, is a meta-heuristic algorithm which selects its parameters according to maximum likelihood. This algorithm, robust against local minima, is far more computationally efficient than the commonly used grid search method. For variable selection, the optimal parameter values were then utilized. We used R package pathifier to calculate PDS and glmnet package to construct the model and modified the methods of Hughey and Butte [9] and the functions from R package C060 [17]. We utilized the caret R package which implements e1071 and randomForest packages for support vector machines (SVM) and random forest (RF), respectively, using its default optimization by grid search on set parameter ranges [18].
4. Evaluation strategies
The performance evaluation metrics used in this study were the area under the receiver operating curve (AUROC), the precision-recall curve (AUPRC), Brier score (BS), precision, recall, accuracy (ACC), Matthews correlation coefficient (MCC), and F1 score. Receiver operating curve is a plot of test sensitivity (true positive [TP]/(TP+false negative [FN]) along the y axis versus 1-specificity (1‒true negative [TN]/(false positive [FP]+TN)) along the x axis. Area under the curve (AUC) value ranges from 0.5 (random prediction) to 1 (perfect prediction). Precision-recall curve is a plot characterized by different set of precision (TP/(TP+FP)) and recall (sensitivity) of the model evaluated with selected thresholds. BS is calculated as:
where pi is the predicted probability and oi is the actual outcome of the event and n is the sample size. BS is essentially the mean squared error of the probability forecast of a dichotomous event. Hence, a small BS corresponds to a good calibration of predictions. F1 score is a weighted mean of precision and recall, ranging from 0 (worst value) to 1 (best value). ACC is defined as (TP+TN)/(TP+TN+FP+FN). MCC, considered as a balanced measure, is a geometric mean corrected for chance agreement ((TP×TN)–(FP×FN)/square root ((TP+FP)×(TP+FN)×(TN+FP)×(TN+FN))). Prediction performances of all parameters except BS are directly proportional, ranging from 0 to 1. Higher BS denotes worse performance. MCC ranges from –1 (completely incorrect) to 1 (completely correct). All statistical analyses were performed using R ver. 3.2.3 (R Foundation for Statistical Computing Platform, Vienna, Austria).
Results
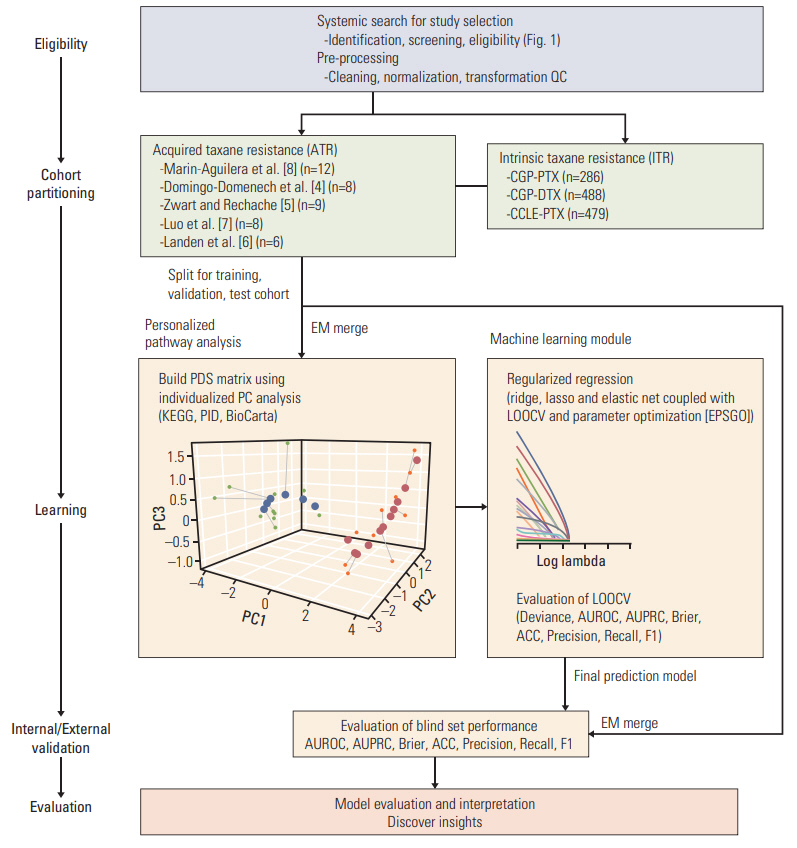
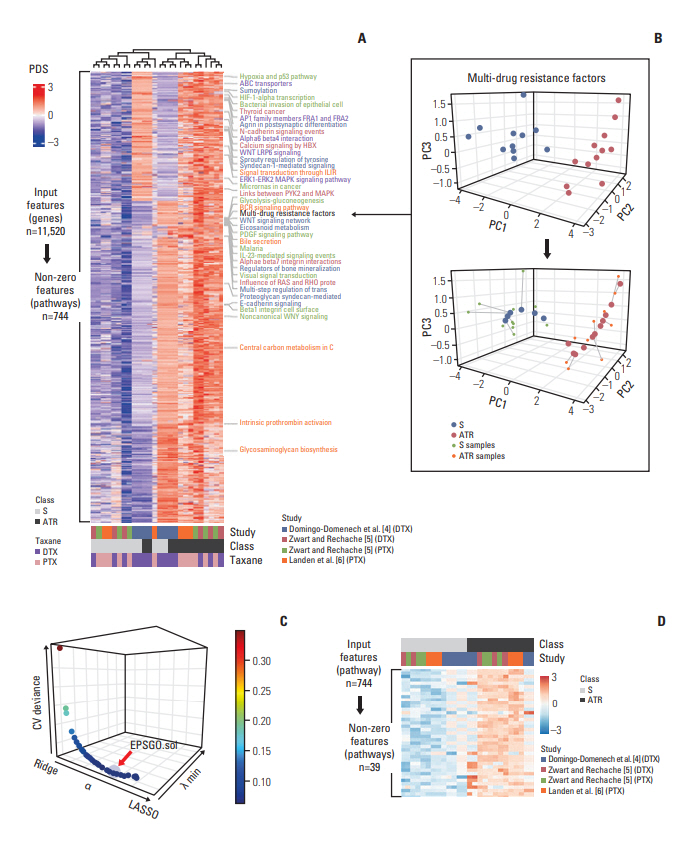
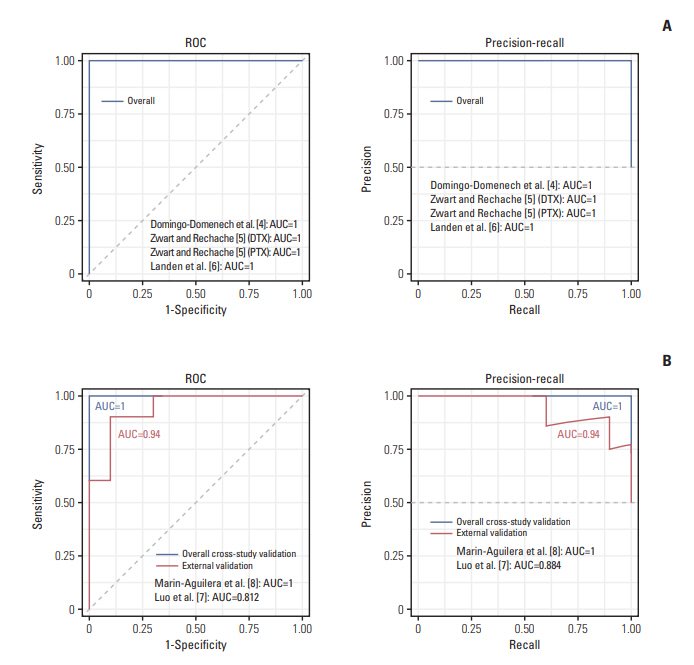
To develop a robust and generalized ATR prediction model based on personalized pathway information, we devised a workflow that integrates multi-study, and multiplatform penalized machine learning method with individual pathway deregulations in taxane treatments (PTX, DTX) in various cancer cell lines (Fig. 2). Three microarray studies (GSE36135-DTX-prostate, GSE28784-DTX and PTX-breast, GSE23779-PTX-ovarian) were used as a development study set for model construction. For external blind validation, two independent cohorts (GSE12791-PTX-breast and GSE33455-DTX-prostate) were used to test the algorithm’s generalizability and transferability. To explore possible transferability between intrinsic taxane resistance (ITR) and ATR, we used CCLE and CGP cohorts as a development set and tested ATR cohorts as an external blind. Detailed descriptions of cohorts and the technical variables used in the studies are in Table 1. We merged the three discovery study cohort using the ComBat method [12]. These merged gene expression level data were then transformed into pathway-level information using the Pathifier algorithm which generated a one-dimensional principal curve from a cloud of data points in a highdimensional space (Fig. 3B) and yields a PDS for each individual sample in a context-specific manner (Fig. 3A, see Materials and Methods section) [13]. Using pathway information extracted from the Kyoto Encyclopedia of Genes and Genomes (KEGG) [19], Pathway Interaction Database (PID) [20] and the BioCarta [21], we calculated a principal curve for each pathway and obtained 744PDS from 11520 merged genes (Fig. 3A and B). We then applied regularized regression to PDS matrix to build a prediction model for ATR. Elastic-net regularization linearly combines the ridge and lasso regression [16]. Hyperparameter α adjusts ridge (L2-norm) and lasso penalties (L1-norm), whereas and λ controls the total level of penalization. The hyperparameters are finetuned for an optimal elastic-net penalty function. We used an EPSGO algorithm to optimize α and λ with minimum binomial deviance (Fig. 3C) [17]. At the value that regularization parameter gave the lowest binomial deviance, EPSGOtuned elastic-net selected a parsimonious set of 39 predictors with non-zero pathway dysregulation coefficients (Fig. 3D). Detailed descriptions of 39 non-zero pathways and their gene components are in S1 Table and S2A Fig. Out of 39 non-zero pathways, five most informative pathways with coefficients greater than 1 were Biocarta’s “HYPOXIA AND P53 IN THE CARDIOVASCULAR SYSTEM,” BioCarta’s “MULTI-DRUG RESISTANCE FACTORS,” KEGG’s “BILE SECRETION,” PID’s “ALPHAE BETA 7 INTEGRIN CELL SURFACE INTERACTIONS,” and KEGG’s “ABC TRANSPORTERS” (S2B Fig.). The final elastic-net model produced a perfect performance on leave-one-out cross-study validation. The overall AUROC for the three development cohorts were 1.000 with a AUPRC of 1.000, a BS of 0.007 and a sensitivity, specificity of 100% (Tables 2, 3, Fig. 4A). We further validated the generalizability of our model using two external validation cohorts. Our algorithm showed excellent performances on both independent test sets. The overall AUROC for the two external blind cohorts were 0.940 (95% confidence interval [CI], 0.841 to 1.000) with an AUPRC of 0.940 and a BS of 0.127 (Fig. 4B). The sensitivity and specificity of the algorithm were 90.0% and 80.0%, respectively (Table 3). The algorithm showed excellent performance on leave-one-out cross-validation compared to RF or SVM (S3 Fig.).
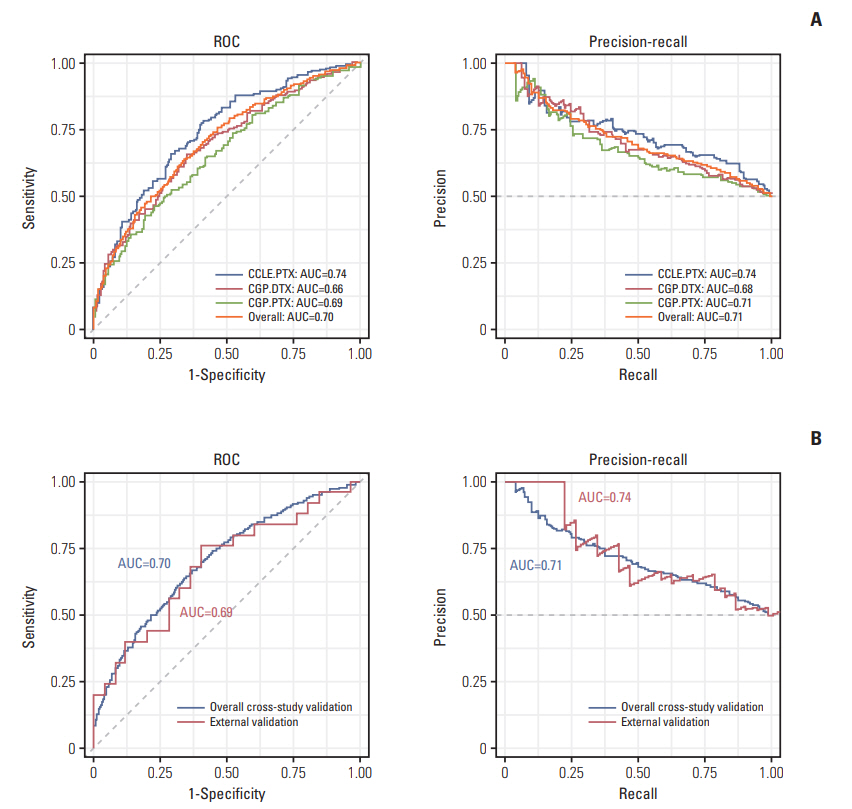
Next, we explored whether a transferability exists between ITR to and ATR. We classified the CCLE and CGP data as sensitive (below the median IC50 or area under curve values) or resistant (above the median IC50 or area under curve values). After classification, the total of 239, 143, 244 samples were obtained in the drug-sensitive (S) group and 240, 143, 244 in the resistant (R) groups of CCLE-PTX, CGP-PTX, CGPDTX, respectively. In leave-one-out cross-study validation for CCLE and CGP, our algorithm showed a high discrimination ability with an overall AUROC of 0.703 (95% CI, 0.674 to 0.731), an AUPRC of 0.712, a BS of 0.218, a sensitivity of 61.7% and a specificity of 67.1% (Tables 4, 5, Fig. 5A). Considering the accuracies previously reported on consistency between CGP and CCLE were close to random level at 0.5, our model’s performance was remarkable. Next, we tested whether this ITR-based model could predict ATR. Surprisingly, our ITR-based model had a good prediction performance on ATR (overall AUROC, 0.688 [95% CI, 0.539 to 0.837]; AUPRC, 0.735; BS, 0.226; sensitivity, 68.0%; and specificity, 64.0%), suggesting high transferability between ITR and ATR (Table 5, Fig. 5B).
Discussion
The transferability and generalizability of our model may be attributed to using multi-study–derived and pathwaybased regularized regression. Our model showed high generalizability for ATR by producing near-perfect performance in both internal cross-study validation and external validation. We associate the model’s robustness with our two-step approach of multi-study–derived pathway mapping and penalized regression to maximize generalizability. The first step was to convert genomic information into pathway information because pathways represent multifactorial nature of cancer and drug resistance better than individual genes. The second step was to use penalized regression to avoid overfitting and secure interpretability.
CCLE and CGP have provided, since their publications, pharmacogenomic information for prediction of drug sensitivity. Yet, recent studies documented that the inconsistency of two studies, largely on pharmacologic response to antitumor drugs, may be problematic for studies based on these datasets. A past study observed very poor correlation of IC50 between CCLE and CGP (Pearson rho of 0.18 in IC50 for PTX with SVM classifier) [2]. Another study reported a similar finding, citing PTX among the major cause for drug/cell line inconsistency (Spearman’s rank correlation coefficient 0.1-0.2) [3]. Recently, Dong et al. [22] applied linear (SVM) and non-linear (random forest) modeling and addressed that, although SVM achieves better performance (0.55) for PTX than RF predicting model (0.482), the values were not much higher than random prediction. Our internal cross-study validation using CCLE and CGP cohorts shows the model with pathway mapping approach is highly consistent between CCLE and CGP (overall cross-study AUC, 0.703), compared to the almost random levels reported in previous studies. Applying this model on ATR cohorts, we further tested whether a model built from intrinsic resistance dataset can predict AR. Surprisingly, prediction parameters were as high, suggesting the model’s generalizability over intrinsic and acquired resistant cell lines (overall AUC, 0.688).
By using pathifier and penalized regression, we achieved parsimony, narrowing 11,520 input gene features down into 39 non-zero pathways. Interestingly, compared to ATR, the number of coefficients (features) for ITR are much greater than for ATR (S4A and S4B Fig.). This is suggesting ITR had a broader feature selection. Although intrinsic and acquired resistances are explained by different mechanisms, the algorithm may have captured the common pathways shared by both ATR and ITR. This may be one of the reasons that our model developed from ITR data (CCLE, CGP) was transferable to predict ATR with good accuracy. We additionally examined whether ATR-based model predicted ITR and observed near-random performance (data not shown). This implies the smaller number of feature selection for ATR might be due to the presence of AR-specific pathways. Further knowledge of resistant mechanisms is needed to fully understand this outcome.
One advantage of using regression-based models in medical sciences is results are highly interpretable, compared to “black-box” models such as deep learning, SVM and random forest. It is interesting to note that KEGG’s “BILE SECRETION” and PID’s “ALPHAE BETA 7 INTEGRIN CELL SURFACE INTERACTIONS” were among the top 5 most informative pathways with coefficient greater than 1 (S2B Fig.). While the other top pathways (Biocarta’s “HYPOXIA AND P53 IN THE CARDIOVASCULAR SYSTEM,” BioCarta’s “MULTI-DRUG RESISTANCE FACTORS,” and KEGG’s “ABC TRANSPORTERS”) have been consistently associated with chemoresistance with previous studies to suggest robustness of the model [23], no direct physiological relationship between bile secretion, integrin β7 and taxane resistance has been reported in previous studies [24,25]. Integrins are reported to be implicated in cell adhesion-mediated drug resistance and the examples include integrin β1, which was among 39 non-zero features, for erlotinib resistance in lung cancer and lapatinib/trastuzumab in breast cancer [26]. Yet, the role of integrin β7, one of the most informative feature according to our algorithm, in drug resistance has not been thoroughly studied. Further investigations into bile secretion and integrin β7 pathway may provide novel molecular target candidates for ATR.
An accurate model will be valuable for clinical decision making, providing most effective and least toxic drug choices. In this study, we developed a multi-study–derived personalized prediction model for ATR with excellent accuracy, generalizability and transferability.