Synthetic CDCA Derivatives-Induced Apoptosis of Stomach Cancer Cell Line SNU-1 Cells
Article information
Abstract
Purpose
This study was conducted to explore whether CDCA derivatives induce apoptosis in a stomach cancer cell line, and to dissect the detailed mechanism underlying apoptosis.
Materials and Methods
The human stomach cancer cell line, SNU-1, cells were treated with the synthetic CDCA derivatives, HS-1199 and HS-1200. DNA and mitochondrial stains were used to detect apoptotic cells by fluorescence imaging or flow cytometry. The caspase-3 activity was measured by Western blotting.
Results
Both the HS-1199 and HS-1200 induced decreased viabilities of the SNU-1 cells, in time-dependent manners. The CDCA derivatives demonstrated various apoptosis hallmarks, such as mitochondrial changes (reduction of MMP, cytochrome c release, and Smac/ DIABLO translocation), activation of caspase-3 (resulting in the degradation of PARP and DFF45), DNA fragmentation and nuclear condensation.
Conclusion
The CDCA derivatives, HS-1199 and HS-1200, both induced apoptosis of the SNU-1 gastric cancer cells in caspase- and mitochondria-dependent fashions. Many important issues relating to their therapeutic applications remain to be elucidated.
INTRODUCTION
Bile acids are polar derivatives of cholesterol essential for the absorption of dietary lipids, and regulate the transcription of genes that control cholesterol homeostasis. Depending on the nature of their chemical structure, different bile acids exhibit distinct biological effects (1). After synthesis by the liver, and their excretion into the bile canaliculus and digestive tract, the primary bile acids, cholic acid (CA) and chenodeoxycholic acid (CDCA), are metabolized by enteric bacteria to produce secondary bile acids, primarily deoxycholic acid (DCA), ursodeoxycholic acid (UDCA) and lithocholic acid (LCA). Bile acids are conjugated to glycine or taurine when the glycine conjugates predominate. Conjugation of bile acids to glycine and taurine is one mechanism by which an organism can decrease the hydrophobicity of a bile acid (2), rendering the molecules less cytotoxic at physiological concentrations. Numerous studies have shown that elevated concentrations of bile acid within the liver induce hepatocyte apoptosis, providing a cellular mechanism for bile acid-mediated liver injury (3). Bile acid hydrophobicity is correlated with the induction of apoptosis and/or growth arrest (4). Highly hydrophobic bile acids, such as DCA and CDCA, are able to rapidly induce apoptosis.
Stomach epithelial cells can not transport natural bile salts intracellularly. Thus, studies of the effects of bile acid on stomach cancer are lacking. In an experiment evaluating the early influence of H. pylori infection on cell kinetics in the antral mucosa of mice, bile had no promotional effect on cell proliferation (5). However, in another experiment, the combination with taurocholic acid showed a synergistic effect on H. pylori-enhanced epithelial cell proliferation (6).
CDCA, a primary bile acid, acts as a tumor promoter in animal models, enhances cell transformation in vitro and induces apoptosis in several different tumor cell lines (1). Several laboratories have identified farnesoid X receptor (FXR) as a CDCA receptor and PKC was suggested as a signaling mediator of CDCA (2).
Various activities of CDCA on cells have also been reported. Hydrophobic CDCA is known as a tumor promoter in certain experimental system. It also enhances cell transformation in vitro and apoptosis in several different tumor cell lines, such as HCT116 and HT29 human colon cancer cells (1,7). During the apoptosis of HCT116 cells, caspase-3 activity was stimulated, and along with apoptosis, was able to be suppressed by bcl-2. Noticeably, over-expression of bcl-2, or inhibition of PKC activity, caused the mode of cell death to switch from apoptosis to necrosis (8). CDCA also induced AP-1 activity in human colon adenocarcinoma (9) and hepatic stellate cells (7). In human esophageal adenocarcinoma cells, CDCA induced cyclooxygenase-2 expression (10). In human colon cancer Caco-2 cells, it induced c-fos gene expression through PKC activation (11). CDCA has been demonstrated to be an endogenous promoter of gastrointestinal cancer (10). The ability of bile acids to induce apoptosis, as well as stimulate proto- oncogenes, such as cyclooxygenase-2, c-myc and AP-1, suggests that they may exert their tumor promoting activity by modulating intracellular signaling and gene expression, which will consequently change cell growth and tumorigenesis (10).
Recently, synthetic CDCA derivatives have been investigated pertaining to their anti-proliferating activity (12). The L-phenyl alanine benzyl ester (HS-1199) and L-alanine benzyl ester (HS-1200) conjugates of CDCA induced apoptosis via a p53-independent pathway in human breast carcinoma cells (13), and also showed apoptotic activity in human leukemic T cells through the activation of caspases (12). This study was conducted to explore the fundamental mechanism via which synthetic CDCA derivatives regulate apoptosis and their potential therapeutic use in stomach cancer cells.
MATERIALS AND METHODS
1) Reagents
The rabbit polyclonal anti-human AIF, caspase-3, DFF-45, anti-horse cytochrome c and bcl-2 antibodies were obtained from Santa Cruz Biotechnology (Santa Cruz, CA). The rabbit polyclonal anti-human poly (ADP-ribose) polymerase (PARP) antibody was from Oncogene (Cambridge, MA) and the mouse monoclonal anti-human XIAP (inhibitory protein of apoptosis) antibody from Stressgen Biotechnologies (Victoria, Canada). The rabbit polyclonal anti-mouse Smac/DIABLO antibody was from Calbiochem (San Diego, CA). The FITC-conjugated goat, HRP-conjugated donkey anti-rabbit and HRP-conjugated horse anti-mouse IgGs were from Vector (Burlingame, CA). The TUNEL reaction mixture was from Boehringer Mannheim (Mannheim, Germany). The ECL Western blotting detection reagents were from Amersham International (Buckinghamshire, UK). The 5,5,6,6-tetrachloro-1,1,3,3-tetraethylbenzimidazol carbocyanine iodide (JC-1) was from Molecular Probes (Eugene, OR).
2) Preparation of CDCA derivatives
The following diagram shows a graphical representation of the CDCA structure, and where modifications occurred. The conjugate form of CDCA, with β-alaninbenzyl ester (N-((3α, 5β, 7α)-3,7-dihydroxy-24-oxocholan24-yl) β-alanine benzyl ester: HS-1200), was synthesized as follows: To a solution of 1.0 g (2.76 mmol) CDCA in 20 ml DMF, 631 mg (3.06 mmol) DCC and 400 mg (2.96 mmol) HOBT were added at 4℃. After stirring at 4℃ for 40 min, 1.0 g (4.64 mmol) of β-alanine benzyl ester p-toluenesulfonate salt in 10ml of DNF and 590µl TEA (4.20 mmol) were also added. After stirring overnight at room temperature, the reaction mixture was diluted with 200 ml of ethyl acetate, washed with magnesium sulfate and concentrated under reduced pressure. The residue was purified by flash chromatography to give 1.05 g (67%) of N-((3α, 5β, 7α)-3,7-dihydroxy-24-oxocholan24-yl) β-alanine benzyl ester (HS-1200) as a yellow foam: Rf 0.33 (SiO2, 80% ethyl acetate-hexane); 1H NMR (200 MHZ, CDCL3) 7.34 (br s, 5H), 6.00 (br s, 1H), 5.13 (s, 2H), 4.11 (q, 2H, J=7.33), 3.55~3.47 (m, 2H), 2.57 (t, 2H, J=6.59), 2.29-0.89 (m, 34H), 0.63 (s, 3H); 13C NMR (50 MHZ, CDCL3) 173.5, 172.3, 135.5, 128.4, 128.2, 128.0, 72.2, 71.7, 68.1, 66.3, 60.2, 55.7, 50.2, 42.5, 41.4, 39.6, 39.3, 35.3, 34.9, 34.7, 34.5, 34.0, 33.3, 32.6, 31.6, 30.5, 23.5, 22.6, 20.8, 20.4, 18.2, 14.0, 11.6.
3) Cell culture
SNU-1 cells were maintained at 37℃ in a 5% CO2 air atmosphere in DMEM with 4 mM L-glutamine, 1.5µg/l sodium bicarbonate, 4.5µg/l glucose and 1.0 mM sodium pyruvate, supplemented with 10% FBS.
4) Synthetic CDCA derivatives treatment
Twenty four hours after the cells had been subcultured, the original medium was removed. The cells were washed with PBS and then incubated in the same fresh medium. CDCA, HS-1199 or HS-1200, from a stock solution, was added to the medium to obtain a 50µM dilution of the drug; the dose concentration required for half-maximal inhibition of viability. The concentration of ethanol used in this study, as a vehicle for the bile acids, had no effect on the cell viability in the preliminary studies.
5) Trypan blue dye exclusion
The cells treated with HS-1200 or HS-1199 were harvested at various time points, stained with trypan blue and then counted using a hemocytometer.
6) Hoechst staining
The cells were harvested and the suspension centrifuged onto a clean, fat-free glass slide using a cytocentrifuge. The samples were stained in 4µg/ml Hoechst 33,342 at 37℃ for 30 min and fixed for 10 min in 4% paraformaldehyde.
7) TUNEL technique
The cells were harvested and the suspension centrifuged onto a clean, fat-free glass slide using a cytocentrifuge. The samples were fixed for 30 min in 4% paraformaldehyde, incubated on ice in permeabilization solution for 2 min and labeled in the TUNEL reaction mixture for 60 min at 37℃.
8) Immunofluorescent staining
The cells were harvested, cytocentrifuged and fixed in 4% paraformaldehyde for 10 min, incubated with anti-cytochrome c antibody for 1 h and then with FITC-conjugated secondary antibody for 1 h at room temperature. The cells were mounted with PBS, and observed and photographed under an epifluorescence microscope.
9) Cell counts and photomicrography
The samples were observed under epifluorescence microscopy, and for each time point, and the number of cells showing condensed or fragmented nuclei with Hoechst staining, demonstrated a positive TUNEL reaction or lost the punctate staining pattern for cytochrome c, were determined by a blinded observer from a random sampling of 250~300 cells per experiment. Four independent experiments were conducted. The cells were photographed under epifluorescence microscopy.
10) Assay of mitochondrial membrane potential
The changes in the mitochondrial membrane potential (MMP) were determined by staining cells with the indicator dye, 5,5, 6,6-tetrachloro-1,1,3,3-tetraethylbenzimidazol carbocyanine iodide (JC-1). JC-1 was added directly to the cell culture medium (1µM final concentration) and incubated for 15 min. The medium was then replaced with PBS, and the cells quantified by their J-aggregated fluorescence intensity in a modular fluorometric system, using excitation and emission filters of 492 and 590 nM, respectively.
11) Western blot analysis
2×10⁶ cells were treated with bile acids, washed twice with ice-cold PBS, resuspended in 100µl ice-cold solubilizing buffer (300 mM NaCl, 50 mM Tris-Cl (pH 7.6), 0.5% Triton X-100, 2 mM PMSF, 2µl/ml aprotinin and 2µl/ml leupeptin) and incubated at 4℃ for 30 min. The lysates were centrifuged at 14,000 rpm for 15 min at 4℃, and SDS and Na-DOC (final concentration 0.2%, respectively) added. The protein concentrations of the cell lysates were determined by the Bradford method (Bio-Rad protein assay). Equal amounts of protein were subjected to 15 or 7.5% SDS/PAGE for caspase-3 and PARP, respectively, and transferred to a nitrocellulose membrane. Western blot analyses were carried out using the appropriate antibody, as noted in the figure legends, and immunostaining with antibodies performed using ECL Western blotting detection reagents.
12) Quantification of DNA hypoploidy by flow cytometry
Ice cold 95% ethanol, with 0.5% Tween 20, was added into the cell suspension to a final ethanol concentration of 70%. The fixed cells were pelleted and washed in 1% BSA-PBS solution. The cells were resuspended in 1ml PBS, containing 11 Kunitz U/ml RNase, incubated at 4℃ for 30 min, washed once with BSA-PBS and resuspended in PI solution (50µg/ml). After cells had been incubated at 4℃ for 30 min in the dark and washed with PBS, the DNA content was measured on a Epics XL (Beckman Coulter, FL) and the data analyzed using the Multicycle software, which allowed the simultaneous estimation of the cell-cycle parameters and apoptosis.
13) Statistical analysis
The statistical results were expressed as the mean±the standard deviation of the means obtained from each independent experiment. The results of the experimental and control a groups were tested for statistical significance by a one-tailed Student's t-test or a two-tailed ANOVA.
RESULTS
1) Viability of SNU-1 decreased after CDCA derivatives treatment
Both HS-1199 and HS-1200 produced significant time-dependent decreases in the cell viability, whereas the CDCA did not (Fig. 1).

The viability of SNU-1 was decreased after the CDCA derivatives treatment. 50µM of both HS-1199 and HS-1200 produced significant time-dependent decreases in the cell viability (0~7 h, p<0.01), whereas CDCA did not.
2) Nuclear condensation induced by CDCA derivatives was demonstrated
Hoechst staining demonstrated that CDCA derivatives induced a change in the nuclear morphology. Compared to the typical round nuclei of the control or CDCA-treated cells (Fig. 2A, B), the HS-1199 and HS-1200 treated cells displayed condensed and fragmented nuclei (Fig. 2C, D). The percentage of dead or dying cells, as determined by the nuclear morphology, was significantly increased in the CDCA derivatives-treated cells, in time-dependent manners (Fig. 2E).
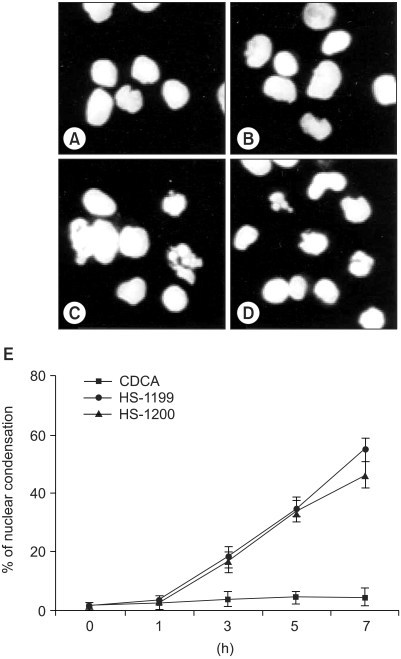
Nuclear condensation induced by CDCA derivatives was demonstrated five hours after treatment. Hoechst staining demonstrated that CDCA derivatives induced a change in the nuclear morphology. Compared to the typical round nuclei of the control or CDCA-treated cells (A&B), the cells treated with 50M of both HS-1199 and HS-1200 displayed condensed and fragmented nuclei (C&D). The percentage of dead or dying cells, as determined by nuclear morphology, was significantly increased in the CDCA derivatives-treated cells in a time-dependent manner (E; 0~7 h, p<0.01).
3) CDCA derivatives produced DNA fragmentation
The treatment of SNU-1 cells with the CDCA derivatives resulted in DNA fragmentation, as determined by the TUNEL assay (Fig. 3).

CDCA derivatives produced DNA fragmentation five hours after treatment. Treatment of SNU-1 cells with 50µM of the CDCA derivatives, HS-1199 and HS-1200, resulted in DNA fragmentation, as determined by the TUNEL assay (*, p<0.01).
4) CDCA derivatives produced decrease of MMP
Loss of mitochondrial membrane potential (ΔΨm) is known to be a common event in many pathways of apoptosis induction. In this study, the potential-sensitive fluorescent probe JC-1 was employed to detect loss of ΔΨm. As depicted in figure 4, the membrane potential was rapidly reduced 7 h after treatment with the CDCA derivatives.
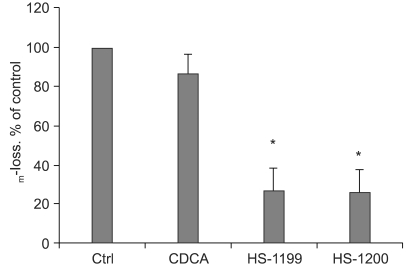
CDCA derivatives produced reductions in the MMP. Loss of mitochondrial membrane potential (ΔΨm) is known to be a common event in many pathways of apoptosis induction. In this study, the potential-sensitive fluorescent probe JC-1 was employed to detect loss of ΔΨm. As depicted in figure 4, the membrane potential was rapidly reduced 5 h after treatment with 50µM CDCA derivatives. ΔΨm decreased significantly in the CDCA derivative-treated cells (*, p<0.01).
5) CDCA derivatives produced cytochrome c release to cytosol
In the immunofluorescent study, the cytochrome c in the control and CDCA-treated cells was found in a punctate pattern, in keeping with its normal mitochondrial location (Fig. 5A, B). The location of the cytochrome c in the mitochondria was confirmed by a double staining of HSP-60 on the same sample (data not shown). However, the CDCA derivatives led to the release of cytochrome c from the mitochondria into the cytosol (Fig. 5C, D). Quantification data are also shown (Fig. 5E).
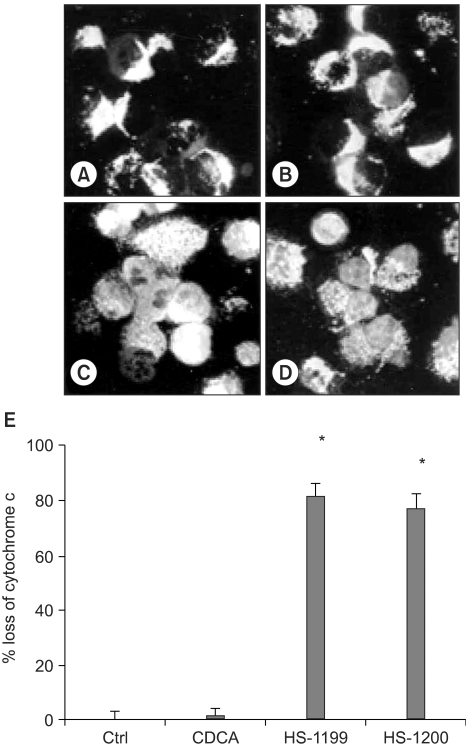
CDCA derivatives produced cytochrome c release to cytosol. In the immunofluorescent study, the cytochrome c in the control and CDCA-treated cells were found in punctate patterns, in keeping with its normal mitochondrial location (A&B). The location of the cytochrome c in the mitochondria was confirmed by double staining of the HSP-60 in the same sample (data not shown). However, 50µM of the CDCA derivatives, HS-1199 and HS-1200, treatment led to the release of cytochrome c from the mitochondria into the cytosol (C&D). Quantification data (5 h) are also shown (E; *, p<0.01).
6) AIF and Smac/DIABLO were released from mitochondria
In the imunofluorescent study, the AIF and Smac/DIABLO in the control and the CDCA-treated cells were found in a punctate pattern (Fig. 6A, B, E, F). The CDCA derivatives led to the release of both factors. The AIF and Smac/DIABLO were translocated onto the nuclei cytosol, respectively (Fig. 6C, D, G, H).
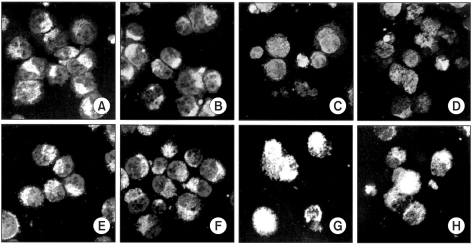
AIF and Smac/DIABLO were released from mitochondria. In the immunofluorescent study, the AIF and Smac/DIABLO in the control and 50µM CDCA-treated cells were found in punctate patterns (A&B, E&F). The CDCA derivatives led to the release of both factors. The AIF was translocated onto the nucleus, whereas the Smac/DIABLO to the cytosol (C&D, G&H).
7) Western blotting shows changes of apoptosis-related proteins in this type of apoptosis
In the CDCA derivatives-treated cells the AIF expression increased, whereas that of the XIAP decreased. However, the CDCA derivatives showed no difference in the expression levels compared to the control or CDCA-treated cells. CDCA derivatives treatments evidently displayed activation of caspases-3, resulting in the degradations of PARP and DFF45. A 32 kDa precursor of caspase-3 was degraded, resulting in 17- and 11-kDa cleavage products. The PARP 85-kDa and DFF45 11-kDa cleavage products were shown to be increased in time dependent manners by the CDCA derivatives-induced apoptosis (Fig. 7).

Western blotting shows changes of the apoptosis-related proteins in this type of apoptosis. In the 50µM CDCA derivatives-treated cells the AIF expression increased, whereas that of the XIAP decreased. However, the CDCA derivatives showed no difference in the expression levels compared to the control or CDCA-treated cells. CDCA derivatives treatment evidently displayed activation of caspases-3, resulting in the degradations of PARP and DFF45. A 32 kDa precursor of caspase-3 was degraded, resulting in 20- and 17-kDa cleavage products. The PARP 85-kDa and DFF45 11-kDa cleavage products were shown to increase in time dependent manners by CDCA derivatives-induced apoptosis.
8) CDCA derivatives did not produce specific cell cycle phase arrest
In the CDCA derivatives-treated cells, the percentage of cells showing DNA hypoploidy increased, but the arrest of a specific cell cycle phase was not observed (Fig. 8)
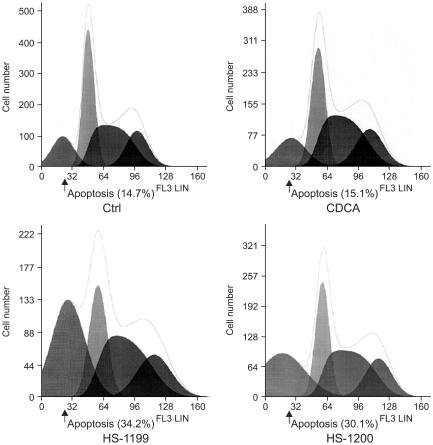
The CDCA derivatives produced no specific cell cycle phase arrest. In the 50µM CDCA derivatives-treated cells, the percentage of cells showing DNA hypoploidy increased. However, arrest of specific cell cycle phase was not observed.
DISCUSSION
The growth inhibitory effect of the synthetic bile acids was derived from induction of apoptosis, with several characteristic features. After exposure to synthetic bile acids, morphological changes in the nuclei were observed by nuclear staining with DAPI (14). This study also revealed nuclear condensation in CDCA derivatives-induced apoptosis by Hoechst staining.
Apoptotic cell death due to the synthetic bile acid derivatives was also confirmed by DNA fragmentation (13). It has been proposed that the DNA fragmentation resulted from the loss of compartmentalization of DNase I, which would reach the nucleus due to the breakdown of the endoplasmic reticulum and nuclear membrane. This cleavage produces ladders of DNA fragments, with integer multiples sizes of a nucleosome length (180~200 bp) (15). The result of the present study also indicated DNA fragmentation in the CDCA derivatives-induced apoptosis, as shown by the TUNEL assay.
When cells undergo apoptosis, specific degradation of several proteins, such as lamin B and poly (ADP-ribose) polymerase (PARP), followed by internucleosomal DNA degradation, has been reported (16). PARP is an enzyme involved in DNA repair and genomic integrity, and is used as a biochemical marker of chemotherapy-induced apoptosis, as mentioned above (17). A collapse of chromatin and the nuclear structure in apoptosis is also consistent with the degradation of lamins, which are part of the nuclear envelope. Cleavages of PARP and lamin B were shown due to treatment of the synthetic bile acid derivatives (13). In this study, evidence of PARP cleavage was demonstrated.
Several members of the caspase family, including caspase-3 and -8, have been identified as proteases, which cleave PARP protein (18). Therefore, subsequent experiments addressed the issue of whether synthetic bile acid derivative-induced apoptosis was associated with caspase activation. The immunoblot analysis revealed that the steady-state levels of both caspase-3 and caspase-8 proteins were markedly decreased in cells treated with the synthetic bile acids (12), suggesting that caspase-mediated signaling might contribute to the synthetic bile acid-mediated apoptosis in Jurkat cells. By comparison, CDCA and UDCA themselves did not affect the levels of caspase-3 and caspase-8 expressions. Furthermore, the apoptotic markers, including chromatin condensation, DNA ladder formation and proteolytic cleavage of PARP, were completely prevented when cells were pretreated with zVAD-fmk and DEVD-fmk, which are a broad-spectrum inhibitor of caspases and a specific inhibitor of caspase-3 (12), respectively. This study showed caspase-3 is activated in CDCA derivatives-induced apoptosis of SUN-1 cells.
The bcl-2 oncoprotein, and other related proteins, might play important roles in determining whether cells undergo apoptosis.
The increased expression of Bax can induce apoptosis by suppressing the activity of bcl-2 (19). It was also reported that the ratio of bcl-2 to bax, rather than bcl-2 alone, was more important for the survival of drug-induced apoptosis (20). Although bcl-2 expression was not significantly changed in MCF-7 cells treated with the synthetic bile acid derivatives, there was a significant increase of bax expression (13). Additionally, the expression level of bax was increased, and that of bcl-2 markedly decreased, in MDA-MB-231 cells (13). Taken together, the increased ratio of bax to bcl-2 might contribute to the initiation of apoptosis in synthetic bile acid-treated cells. Although the changes of bax expression level were repeatedly examined, this was not evidently demonstrated (data not shown), but only displayed that there were no differences in the bcl-2 expression level between the control and CDCA derivatives-treated cells.
Alterations in the mitochondrial function in general, and induction of mitochondrial permeability transition (MPT), play a key part in the regulation of apoptosis (21). Moreover, antioxidants and blockers of the mitochondrial permeability transition inhibited the hydrophobic bile acid-induced hepatocyte apoptosis in rats (22). The ΔΨm can be monitored in living cells using numerous potential-sensitive dyes. With use of the dyes, not only in apoptosis, but also in numerous in vitro models of necrosis, it has been shown that the ΔΨm dissipates before the plasma membrane disrupts (23).
Previous studies have shown that synthetic bile acids play a novel role in regulating the cell cycle. CDCA derivatives were demonstrated to block G1/S transition (13). Although, this study was limited to a flow cytometry assay, the CDCA derivatives did not induce cell cycle phase specific arrest in SNU-1 cells.
AIF is known to be involved in the early commitment phase of caspase-dependent and independent apoptosis (24). In the present study, the CDCA derivatives were found to induce the translocation of the AIF from mitochondria onto nuclei. Smac/DIABLO is another apoptosis-related mitochondrial factor. This caspase activator factor binds IAPs, blocking their inhibitory function, presumably by disabling their interaction with caspase-9 (25). The results of this study support the involvement of the two factors in CDCA derivatives-induced apoptosis.
Numerous studies have focused on the targeted induction of apoptosis in order to control the unlimited growth of cells. Moreover, induction of apoptosis of the activated cell may promote therapeutic efficiency. Therefore, inducing apoptosis of gastric cancer cells may contribute toward the potential therapeutic management of gastric cancer.
In this study, the synthetic CDCA derivatives, HS-1199 and HS-1200, have been shown, for the first time, to induced apoptosis of gastric cancer cells in a caspase-dependent fashion. In addition, this study presents data suggesting that this type of apoptosis occurs through a mitochondrial pathway. Many important issues for their therapeutic applications remain to be elucidated.
CONCLUSIONS
The CDCA derivatives, HS-1199 and HS-1200, induced apoptosis of SNU-1 gastric cancer cells in both caspase- and mitochondria-dependent fashions.