Studying the Effect of Downregulating Autophagy-Related Gene LC3 on TLR3 Apoptotic Pathway Mediated by dsRNA in Hepatocellular Carcinoma Cells
Article information
Abstract
Purpose
The purpose of this study is to examine the role of the double-stranded RNA (dsRNA) activated Toll–interleukin-1 receptor domain-containing adaptor inducing interferon β (TRIF) signal pathway in triggering apoptosis in hepatocellular carcinoma (HCC) cells.
Materials and Methods
First, siRNA targeted autophagy–related gene LC3 (pU6H1-LC3 siRNA and siLC3) and a dsRNA used as a Toll-like receptor 3 (TLR3) ligand was constructed and synthesized, respectively. Then, a human HCC cell line was transfected with dsRNA, siLC3, and cotransfected with siLC3 and dsRNA (siLC3+dsRNA), respectively. Finally, quantification real-time polymerase chain reaction, western blotting, and immunofluorescence staining were used in the HCC line (SMMC7721), and MTT assay, flow cytometry, terminal deoxynucleotidyl transferase-mediated dUTP nick-end-labeling, and transmission electron microscopy were used in an HCC xenograft model of nude mice. Human umbilical vein endothelial cell tube forming assay, color Doppler ultrasonographic flow image examination, and CD34-positive microvessel density were used in vitro and in vivo.
Results
Compared with untreated cells, the protein and mRNA expression of TLR3 and TRIF was up-regulated, in order, siLC3+dsRNA, dsRNA, and siLC3. Expression of LC3 was obviously down-regulated and the autophagosomes were significantly decreased in siLC3+dsRNA and siLC3, whereas in dsRNA (p < 0.05). LC3 and TRIF colocation was observed in HepG2 cells. Decreased cell viability, increased apoptosis, decrease in xenograft tumor volume, and angiogenesis potential were also observed in order (p < 0.05).
Conclusion
Suppression of intracellular autophagy resulted in decreased degradation of TRIF protein, which can promote triggering of apoptosis by the TLR3-TRIF pathway. dsRNA and siLC3 could play anticancer roles in coordination.
Introduction
Cancer is a multistep human disease related to a series of complex biological processes, encompassing apoptosis and autophagy. Inducing cell apoptosis is a key strategy of tumor therapy. Reduced apoptosis in chemoresistance remains a major clinical obstacle to successful cancer treatment and results in poor prognosis of the patients.
Toll-like receptors (TLRs) play a pivotal role in triggering various innate immune responses associated with both physiological and pathological immunity. After recognizing pathogen-associated molecular patterns or danger-associated endogenous molecules, TLRs activate a signaling pathway through recruitment of two key adaptor molecules, termed myeloid differentiation factor 88 (MyD88) and Toll–interleukin-1 receptor domain-containing adaptor inducing interferon (IFN) β (TRIF, also called TICAM-1) [1]. MyD88 is a universal signaling adaptor for all TLR members except TLR3, whereas TRIF is a unique signaling adaptor only for TLR3 and TLR4. Among the TLRs, activation of TLR3 by viral double-stranded RNA (dsRNA) as well as its analog poly I:C [2] or BM-06 [3], a virus-associated molecular pattern, has been reported. Therefore, dsRNA is a specific ligand for TLR3 signaling specificity by TRIF [4].
Most of the TRIF‑interacting proteins, including RIP1, have been found to mediate apoptosis through the RIP–Fas-associated protein with death domain–caspase-8 pathway [5]. McAllister et al. [6] concluded that activation of the TLR3-TRIF-caspase 8 signaling pathway by dsRNA has a significant impact on cell death and survival in vivo. These studies suggest that TRIF plays divergent roles in TLR3-mediated signaling.
Autophagy, as a type II programmed cell death, is a common and important life process in eukaryotic cells; its main role is clearing and degrading damaged organelles and extra large biological molecules to provide energy and reconstruction of the cellular structure and plays an important role in maintaining cell homeostasis and cellular activities [6]. In tumorigenesis and developmental processes, the role of autophagy is bidirectional, on one the hand, cell autophagy can inhibit cancer cells by preventing the accumulation of toxic or carcinogenic damage to proteins and organelles, on the other hand, it may also promote the growth of tumors by limiting necrosis and inflammation to promote tumor cell survival in metabolic stress or immune suppression [7,8]. Autophagy involves the formation of double-membraned vesicles termed autophagosomes, which sequester cytoplasm and organelles, and then fuse with lysosomes to form autolysosomes, thus degrading the contents of the vacuole [9]. Microtubule-associated protein light chain 3 (LC3), a mammalian homolog of yeast autophagy-related genes (Atg) 8, is known to exist on autophagosomes. Autophagosome formation involves the conversion of LC3-I to the lipidated form LC3-II, consequently conversion from LC3-I to LC3-II is a common indicator of autophagy [9]; therefore, LC3 serves as a widely used marker for autophagosomes [10].
Emerging evidence has recently affirmed autophagic features in cells treated with chemotherapeutic agents. There was a question regarding whether the high level of autophagy induced by cytotoxic drugs should be regarded as a direct cell death; however, cells expressing their viability for long-time survival led to chemoresistance [11]. Therefore, it now seems clear that a major function of autophagy is to fight to keep cells alive under stressful “life-threatening” conditions [12]. Numerous studies have been conducted to determine the molecular mechanism of autophagy, to determine the significance of targeting the autophagic signaling pathway to anticancer therapeutics. According to some research, the high-level of autophagy in tumor cells following anticancer treatment can be regarded as a survival mechanism of cancer cells; thus, therapeutic targeting of the autophagic signaling pathway might represent a novel molecular avenue to reducing chemoresistance [13].
Recent studies have reported on the critical link between pathogen recognition of TLRs and autophagy [14-16]; however, it is not known whether LC3 has any regulatory effect on TLR3 induction of cell apoptosis signaling. In this research, dsRNA synthesis was based on the highly conserved 5′ untranslated region (5′ UTR) of a viral genome with no homology to human genes as a TLR3 ligand to activity of the TLR3-TRIF signal pathway for induction of apoptosis, and siRNA targeted LC3-II (pU6H1-LC3 siRNA and siLC3) was simultaneously constructed for knockdown of autophagy gene LC3, and LC3-based molecular biological and microscopic assays were performed for detection of autophagy in hepatocellular carcinoma (HCC) cells and node mice xenograft tumors to examine the question of whether or not autophagy might inference apoptosis by TLR3-TRIF. These findings will increase our understanding of the relationship between autophagy and apoptosis in HCC.
Materials and Methods
1. dsRNA design and synthesis
dsRNAs sequences were designed based on cell surface TLR3 sensitive viral sequences. A 5′ UTR region of human EV70 (GenBank accession No. DQ201177) is highly conserved in enterovirus families, and highly homologous targeting and no homology with human genome after blasted in the NCBI nucleic acid sequence data bank as a template for design of dsRNA, with a stable secondary structure, Tm value, and GC content. The targeting sequences (5′→3′) of dsRNAs were UAGGUACUUCGAGAAGCCUAGUA TAATACGACTCACTATAGGGAGA (dsRNA, sense), UACUAGGCUUCUCGAAGUACCUA TAATACGACTCACTATAGGGAGA (dsRNA, antisense). The optimal concentration (50 μM) of dsRNA was selected based on the cell growth curve from 24 hours to 72 hours.
2. siRNA targeted LC3-II construction
Three sequences of siRNA were designed on the basis of LC3-II sequences from GenBank (accession No. NM032514.3) using Qiagen siRNA software (Qiagen, Shanghai, China). The designed 21nt sequences were submitted to BLAST analysis to ensure that the selected sequences were specifically targeted. Then, these siRNA sequences targeting LC3-II gene were cloned into pU6H1-GFP vector (5.5 kb, Qiagen) for construction of an siRNA expression plasmid targeting LC3-II (siLC3). pU6H1-GFP vector, showing a green color, was used to assay the function of the transfected siRNA. The effective siLC3 was selected among three siLC3s and verified by sequencing. Information on the three siLC3s is shown in Table 1.

Sequences of three siLC3
3. Cell culture and groups
Four human HCC cells (SMMC-7721, Huh7, HepG2, and MHCC97H) and human umbilical vein endothelial cells (HUVECs) were purchased from the Institute of Cell Biology. HCC cells and HUVECs were maintained in Dulbecco’s modified Eagle medium (DMEM; Invitrogen, Carlsbad, CA) plus 10% fetal bovine serum (Invitrogen), 2 mM L-glutamine, 100 U/mL of penicillin, and 100 μg/mL of streptomycin at 37°C under 5% CO2 in a 95% humidified incubator. After reaching 70% confluence, the cells were transfected with either siLC3 or dsRNA, or co-transfection with both siLC3 and dsRNA (siLC3+dsRNA) using Lipofectamine 2000 (Invitrogen) in accordance with the manufacturer's protocol. HUVECs were used between the third and eighth passages. Simultaneously, untreated cells were used as a control.
4. Quantitative real-time polymerase chain reaction
Total RNA was extracted from cell lines using TRIZOL (Invitrogen). Quantitative real-time polymerase chain reaction (qRT-PCR) was performed to evaluate the mRNA expression of TLR3, TRIF, and LC3 using an ABI 7700 Sequence Detection System (Applied Biosystems, Foster City, CA) according to the manufacturer’s protocol. Cycling for amplification was as follows: 95°C for 3 minutes; 35 cycles at 95°C for 45 seconds, 60°C for 45 seconds, and 72°C for 30 seconds; and terminated at 72°C for 7 minutes. The primer pairs (10 pmol) are listed in Table 2. All samples were run in triplicates. The relative levels of individual mRNA in each sample were calculated using the 2−ΔΔCt method, and glyceraldehyde-3-phosphate dehydrogenase served as a control.
Primer sequences
5. Western blotting
After transfection for 48 hours, cells were lysed with radioimmunoprecipitation assay buffer (Sigma-Aldrich, St. Louis, MO). Then an equal amount of protein was separated by 10% sodium dodecyl sulfate polyacrylamide gel electrophoresis and subsequently transferred to a PVDF membrane with protein, which was blocked for 2 hours with 5% nonfat milk in TBST. Following incubation with the primary antibodies (a rabbit anti-LC3 monoclonal antibody, a mouse anti-TLR3 monoclonal antibody [Abcam, Cambridge, UK], and a mouse anti-TRIF polyclonal antibody [Sigma-Aldrich], all diluted at 1:500 dilution; a rabbit anti–β-actin antibody [Sigma-Aldrich], at 1:2,000 dilution) overnight at 4°C, membranes were washed in TBST for 5 minutes×3 times, followed by incubation with peroxidase-conjugated goat anti-rabbit or goat anti-mouse secondary antibodies (Sigma-Aldrich) at 1:2,500 dilution for 1 hour at room temperature, and developed using a chemiluminescence system (Pierce, Rockford, IL). The film was scanned and the density of the bands measured using Image Quant software (Molecular Dynamics, Sunnyvale, CA) and then expressed as the percentage of the density of the β-actin band.
6. Flow cytometry assay
Flow cytometry (Beckman Coulter, Fullerton, CA) was used to determine the apoptotic rate. The testing cells described above were suspended in 500 μL binding buffer (Becton Dickinson, Franklin Lakes, NJ), incubated with 5 μL annexin V–FITC/PI (Becton Dickinson) and 5 μL propidium iodide (PI; Becton Dickinson) for 15 minutes. Phosphatidyl serine translocation to the cell surface serves as an indicator of early apoptotic cells; therefore, annexin V–positive and PI-negative cells were identified as apoptotic cells. Cell apoptotic ratio was determined using Cell Quest software (FCM, Becton Dickinson).
7. Hoechst staining
Testing cells were exposed to staining solution containing Hoechst 33258 (1 μg/mL, Beyotime Institute of Biotechnology, Haimen, China) at 37°C for 20 minutes. Apoptotic cells were defined as those containing nuclear fragmentation and condensed chromatin. Cells were observed and photographed using a digital fluorescence microscope (Olympus, Tokyo, Japan) at 20 minutes after addition of the staining solution. Chromatin condensation is the most characteristic feature of apoptosis. Cell apoptotic ratio was obtained by counting the number of apoptotic cells with condensed nuclei among all cells in five randomly selected areas.
8. Terminal deoxynucleotidyl transferase-mediated dUTP-biotin nick end labeling assay in cells
Cellular apoptosis was also evaluated using the terminal deoxynucleotidyl transferase (TdT)-mediated dUTP-biotin nick end labeling (TUNEL) method with an in situ cell detection kit (Roche Molecular Biochemicals, Mannheim, Germany), according to the manufacturer’s protocol. Four groups were treated as described above for 24 hours, and then fixed in 4% paraformaldehyde, followed by incubation with 50 μL TUNEL reaction mixture (TdT and fluorescein-dUTP) at 37°C for 1 hour in a humid atmosphere, followed by evaluation of apoptotic cells under a digital fluorescence microscope (Olympus). Cells containing green granules in the nucleus were regarded as positive for TUNEL. A total of 100 cells were counted at high magnification, and the percentage of TUNEL-positive cells was calculated as apoptotic index (AI).
9. Immunofluorescence staining
Cells were incubated with rabbit anti-LC3 monoclonal antibody (1:200), mouse anti-TLR3 monoclonal antibody (1:200), and mouse anti-TRIF polyclonal antibody (1:100) at 4°C overnight, respectively. Staining patterns were visualized with goat anti-rabbit IgG TRITC-conjugated (1:200 dilution) and goat anti-mouse IgG FITC-conjugated (1:200 dilution) secondary antibody for 1 hour at room temperature. Samples were counterstained with Hoechst 33258 and photographed using digital fluorescent microscopy (Olympus).
10. Transmission electron microscopy observation
Cells treated for 24 hours were fixed in ice-cold 2.5% glutaraldehyde in 0.1 mol/L phosphate buffered saline (PBS) at 4°C, and were post-fixed in 1% osmium tetroxide in the same buffer, dehydrated in graded alcohols, embedded in Epon 812, sectioned with an ultra-microtome, and stained with uranyl acetate and lead citrate. Autophagic vacuoles in cells were identified using a transmission electron microscope (Philips CM120, Eindhoven, Netherlands).
11. MTT assay [(3-(4,5)-Dimethylthiazol-2-yl)-2,5-diphenyltetrazolium bromide]
Cells were seeded at 3×10³ cells/well (0.1 mL) in 96-well plates and maintained in phenol-red-free DMEM containing 10% fetal calf serum at 37°C for 12 hours, followed by addition of 10 μL MTT (5 mg/mL) to each well at the time the cells were treated at 24 hours, 48 hours, and 96 hours and the cell mixture was incubated at 37°C for 4 hours. Then, 100 μL dimethyl sulfoxide solution was added to each well to dissolve crystals. The absorbance of the solution was measured at 570 nm using a microplate reader to determine cell viability. Four replicate wells were tested per assay and each experiment was repeated three times.
12. Tube formation assays
Matrigel Basement Membrane Matrix (BD Bioscience, Bedford, MA), 100 μL, was planted in each well and incubated for 30 minutes at 37°C. HUVECs were cultured in the supernatant of the above described experimental cell culture, and then seeded on top of the Matrigel at a density of 3×10⁴ cells/well. Following incubation for 16 hours, the wellswere photographed in five random fields under an inverted phase contrast microscope (200×). The untreated cells formed a branching plexus of tubes on artificial extracellular matrix, such as Matrigel. A tube forming node was defined as one having three or more branches coming from a common center. Quantification was blinded and carried out by counting each nodal branch point having three or more branches. Branch point counts per image constituted the raw data for statistical analysis. There were four images per treatment group. Experiments were run in triplicate.
13. Development of xenograft HCC nude mice models and drug treatment
Six- to eight-week-old specific pathogen-free athymic nude mice (BALB/c Nude, female) were provided by the Animal Experiment Center of Nantong University. To confirm that the cells used for development of xenografts in nude mice were stably transfected with siLC3, dsRNA and siLC3+ dsRNA, colony formation assays were performed for selection of single-cell colonies at 2-3 weeks after growth in soft agar. The selected single-cell clones were then expanded in the medium containing G418. Mice were randomly divided into four groups (n=6 for each group, total 24): single-cell clones (5×10⁶ cells in 0.2 mL basic culture medium) were injected subcutaneously into both sides of the mice nape for development of subcutaneous xenografts in nude mice. The tumor masses were measured every 3 days using a caliper, and tumor volume was calculated according to the following formula: V=ab2/2 mm3 (a and b represent the two maximum diameters, respectively) [17]. The animals were euthanized after 30 days with examination of finished blood signals by B-model ultrasound diagnosis. Subcutaneous tumors were removed and fixed in buffered formaldehyde (4% wt/vol in PBS) and 4-μm paraffin sections were stained in hematoxylin and eosin using standard histological techniques. All nude mice were treated and all procedures were performed in accordance with the guidelines for experimental animals approved by the Animal Care and Use Committee of Nantong University, China.
14. B-model ultrasound evaluating intratumor blood flow signals
The B-mode and color Doppler ultrasonographic flow image examination was performed before the nude mice were sacrificed. Twinkling was performed on the tumors and basilar part of the nude mice to evaluate the blood flow of tumors. Then, flow imaging was analyzed by estimating the red area for flow toward the probe, and the blue for flow back to the probe.
15. Immunohistochemical staining
A two-step immunohistochemical method was performed on formalin-fixed, paraffin-embedded 4-μm sections from all xenografts to detect the expression of TLR3 (1:100), TRIF (1:100), and LC3 (1:100), and apoptosis-related genes caspase 3, caspase 8, and caspase 9 (1:100, Cell Signaling Technology, Danvers, MA) and CD34 (1:100, Zymed Laboratories, South San Francisco, CA). Eight consecutive slides were prepared from each tissue. The slides were deparaffinized by dimethyl benzene and dehydrated by gradient ethanol. For antigen retrieval, slides were heated at 95°C for 10 minutes in sodium citrate buffer (10 mM sodium-citrate monohydrate, pH 6.0), and then allowed to cool for 20 minutes at room temperature, followed by incubation in 0.3% H2O2 at room temperature for 15 minutes to inhibit endogenous peroxidase, and then incubated with primary antibodies at 4°C overnight. A two-step reagent kit (HRP–anti-mouse/rabbit IgG 1:200 dilution, Fuzhou Maixin Biotechnology Co., Ltd., Fuzhou, China) was then applied for detection of the immunoreactivity. Slides were stained using 0.05% 3,3'-diaminobenzidine tetrahydrochloride (DAB) solution (DAB kit IL1-9032, Fuzhou Maixin Biotechnology Co., Ltd.), and sections were slightly counterstained with hematoxylin. Positive controls (human HCC tissues with cytoplasmic TLR3, TRIF, LC3, and caspases 3, 8, 9, and CD34 for microvessels) as well as negative controls (TBS was substituted for primary antibody at the same concentration) were performed for each immunohistochemical run.
16. TUNEL detection in tissues
TUNEL detection kits (Promega, Madison, WI) were used for the detection of cell apoptosis in tissues. In brief, after tissue sections were deparaffinized and dehydrated, sections were treated in order with 20 μg/mL Proteinase K for 20 minutes, 0.3% Triton X-100 for 10 minutes, followed by washing in PBS, TUNEL reaction mixture at 37°C for 1 hour, HRP conjugated streptavidin (1:200, Beijing Zhongshan Biotech Co., Ltd., Beijing, China) at 37°C for 30 minutes, 0.04% DAB and 0.03% H2O2 at room temperature for visualization for 10 minutes, counterstaining with hematoxylin followed by mounting with resin. In the negative control, the TUNEL reaction mixture was replaced with PBS. The positive control sections were pre-treated with DNase I for 10 minutes followed by TUNEL staining. Cells with brownish yellow granules in the nucleus were regarded as positive for TUNEL. The average percentage of TUNEL-positive cells was calculated using a five high powered microscope as AI.
17. Statistical analysis
Data were expressed as the mean±standard deviation and were analyzed using independent samples t test using the statistical software program SPSS ver. 17.0 (SPSS Inc., Chicago, IL). p-values were calculated using Student’s t test and one-way analysis of variance, and were considered significant at levels of p < 0.05.
Results
1. Screening cells especially expressing TLR3 and LC3 mRNA and protein
Under fluorescence microscopy, the TLR3 and LC3 mRNA and protein were located in cytoplasma (Fig. 1A). Expression of TLR3 and LC3 mRNA and protein in SMCC7721, HepG2, MHCC97L, and MHCC97H cells was detected by qRT-PCR (Fig. 1B) and western blotting (Fig. 1C). Because HepG2 cells showed higher mRNA and protein expression of TLR3 and LC3 compared with other HCC cell lines (p < 0.05), HepG2 cell was chosen for the subsequent experiments.
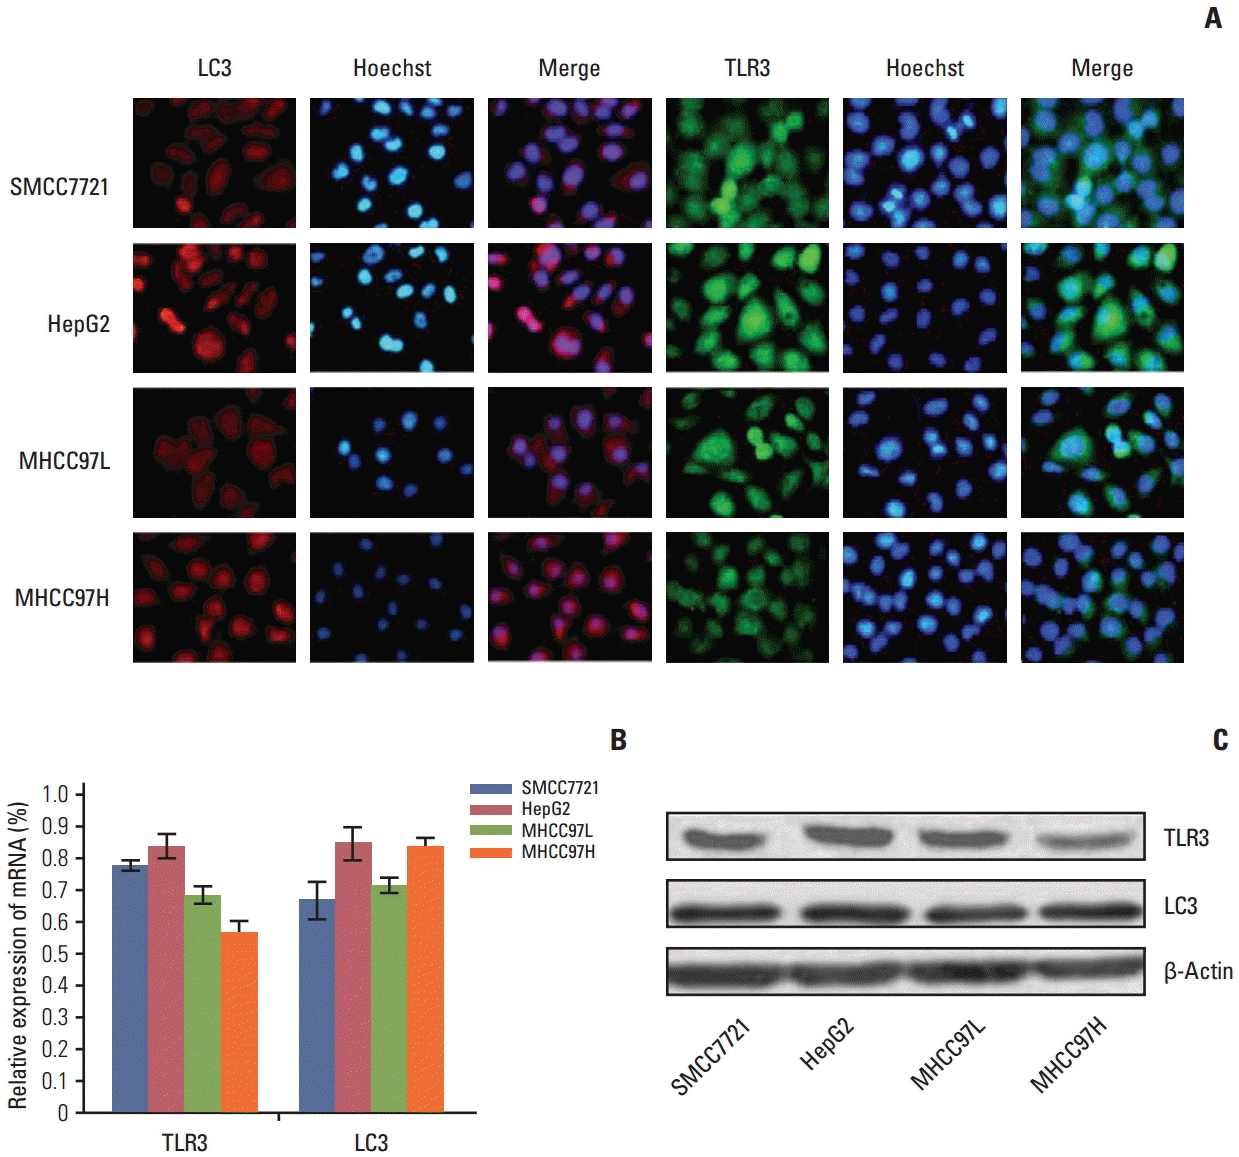
Expression of Toll-like receptor 3 (TLR3) and microtubule-associated protein light chain 3 (LC3) mRNA and protein in different cells. (A) The location of TLR3 and LC3 proteins in different cells by immunofluorescence (×200). (B) Expression of TLR3 and LC3 mRNA in different cells by quantitative real-time polymerase chain reaction. (C) Expression of TLR3 and LC3 proteins in different cells by western blotting.
2. Screening siRNAs especially targeting LC3 mRNA
Electron microscopy was used to monitor the number of autophagosomes. Under transmission electron microscopy, the typical signs of autophagosomes easily determine the most efficient siRNA capable of knocking down LC3 mRNA, the three siRNAs against LC3 genes were transfected with Lipofectamine 2000 into HepG2 cells, respectively. At 48 hours after transfection, total RNA was isolated using TRIzol reagent for qRT-PCR and western blotting was performed. Among the three siRNAs, siLC3-2 exerted a more intense suppressive effect on LC3 mRNA and protein than the other two siRNAs (p < 0.05) (Fig. 2). Therefore, siLC3-2 was chosen for the subsequent experiments.

(A, B) Screening of siRNAs targeting microtubule-associated protein light chain 3 (LC3) mRNA. Among the three siRNAs, siRNA targeted autophagy–related gene LC3 (siLC3)-2 showed a more intense effect in suppression of LC3 mRNA and protein. The “Liposome” in the graph represented HepG2 cells treated only with liposome, and the expression level of this group was taken as 1. *p < 0.05 compared to liposome.
3. Expression of TLR3, TRIF, and LC3 in different testing HepG2 cells
qRT-PCR and western blotting analyses were performed to determine the expression of TLR3, TRIF, and LC3 mRNA and protein in all testing cells. Compared with untreated cells, the mRNA and proteins of TLR3 and TRIF were up-regulated in transfecting cells, in order, with dsRNA+ siLC3, or dsRNA, or siLC3 (every p < 0.05), which showed the effect of activation of the TLR3 signaling pathway by dsRNA and siLC3. LC3 was down-regulated in cells transfected with either dsRNA+siLC3 or siLC3 (p < 0.05, respectively), which determined the inhibiting effect of siLC3. However LC3 was increased in dsRNA (Fig. 3).
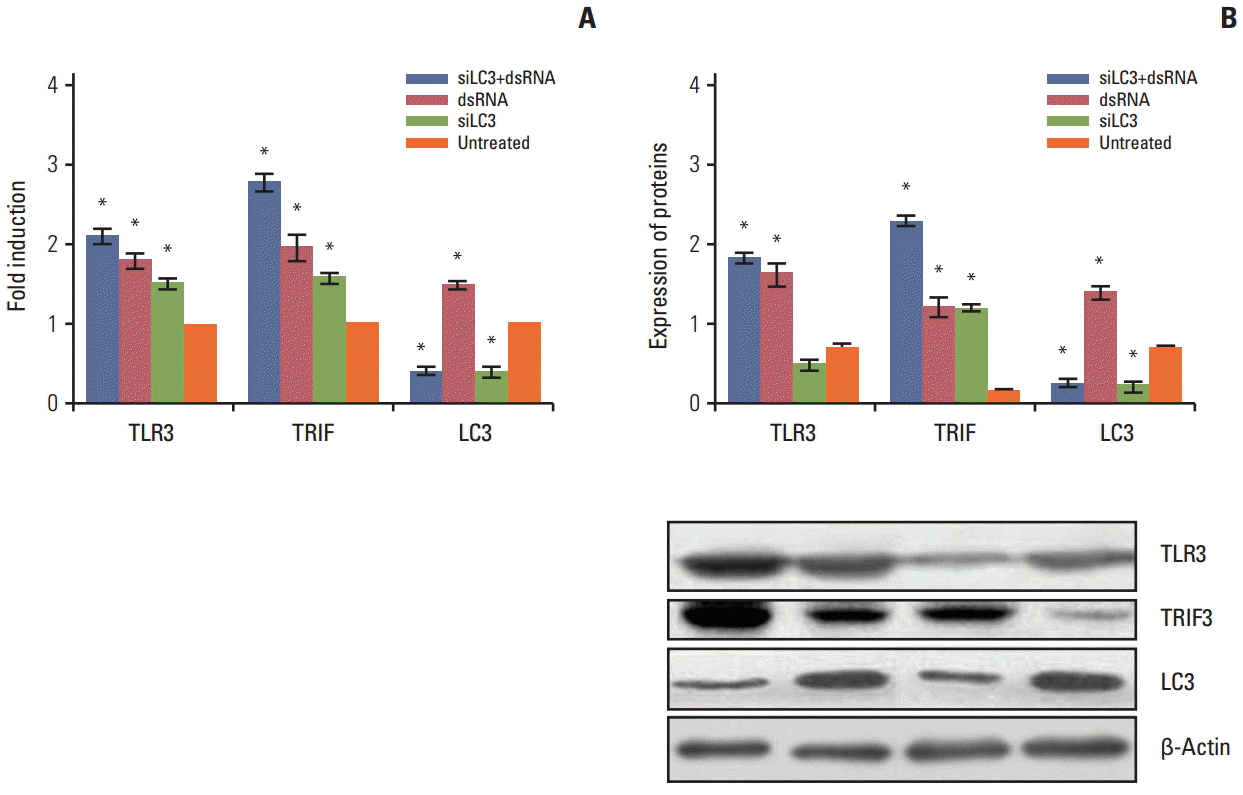
The mRNA and protein expression of Toll-like receptor 3 (TLR3), Toll–interleukin-1 receptor domain-containing adaptor inducing interferon β (TRIF), and microtubule-associated protein light chain 3 (LC3) in all testing HepG2 cells detected by quantification real-time polymerase chain reaction (A) and western blotting (B). The expression levels in the untreated group were taken as 1. The experiment was repeated three times with reproducible results. *p < 0.05 compared to untreated cells. siLC3, siRNA targeted autophagy–related gene LC3.
Fluorescence microscopy detected the subcellular localization of TLR3, TRIF, and LC3. The results indicated that TRIF and LC3 localized mainly in the cytoplasm of cells, and co-localization of both genes was detected in HepG2 cells. Obviously lower expression of LC3 protein was detected in siLC3+dsRNA and siLC3 treated cells compared with that in dsRNA treated cells; however, the expression of TRIF protein was obviously increased (p < 0.05), similar to dsRNA treated cells (p < 0.05) (Fig. 4). However, TLR3 and LC3 protein did not show co-localized expression.

Toll–interleukin-1 receptor domain-containing adaptor inducing interferon β (TRIF) and microtubule-associated protein light chain 3 (LC3) protein expression with co-localization detected by immunofluorescence (×100). FITC and TRITC labeled TRIF (green) and LC3 (red) were localized in the cytoplasm of cells, respectively. The nuclei of cells were counter stained by Hoechst in blue and the merged figure was yellow-green. Compared with untreated cells, TRIF expression was markedly increased in siRNA targeted autophagy–related gene LC3 (siLC3)+dsRNA, dsRNA, and siLC3 treated cells, and LC3 expression was markedly decreased in siLC3+dsRNA and siLC3 treated cells. TRIF and LC3 showed co-localized expression in cytoplasm.
Effects of dsRNA and siLC3 on autophagophagy are observed as autophagic vacuoles with some round shaped double-membrane structures containing normal looking organelles, nucleus and chromatin, indicating autophagosomes, which are possibly derived from ribosome-free endoplasmic reticulum. The average number of autophagosomes was quantified by counting the double-membrane structures in three different fields for each treatment. There were fewer autophagosomes in siLC3 (1.8±0.25) and siLC3+dsRNA treated cells (2.2±0.16) than in dsRNA (4.9±0.31) and untreated cells (3.3±0.13) (p < 0.01). An obvious difference was observed between that in dsRNA and untreated cells (p < 0.05); however, no difference was observed between siLC3 and siLC3+dsRNA treated cells (p > 0.05) (Fig. 5).
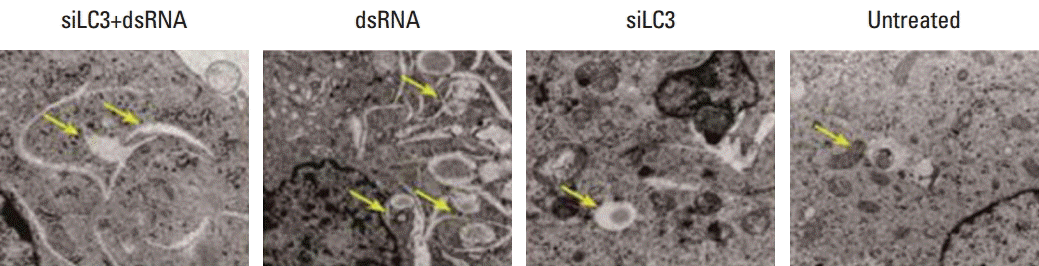
Transmission electron microscopy detected the autophagosomes. Electron microscopic analysis of testing cells. Arrows indicate autophagosome with double-membrane structures (×15,000). siLC3, siRNA targeted autophagy–related gene LC3.
4. Effects of dsRNA and siLC3 on cell apoptosis
First, MTT and tube formation assays were performed to examine the question of whether dsRNA and siLC3 could affect the viability of HepG2 cells and tube formation of HUVECs treated as described above. According to the results, after 48 hours, siLC3+dsRNA treated cells showed the lowest viability (p < 0.01), and viability of dsRNA and siLC3 treated cells was also significantly lower than that in untreated cells (p < 0.01 and p < 0.05), which was associated with a time-dependent inhibition (Fig. 6).

(3-(4,5)-Dimethylthiazol-2-yl)-2,5-diphenyltetrazolium bromide (MTT) detected cell viability in triplicates at different time-points of each experimental group. siLC3, siRNA targeted autophagy–related gene LC3. *p < 0.05 vs. untreated cells.
Flow cytometry analysis of HepG2 cells was performed 24 hours after treatments, the apoptosis rates, in order, were 31.49±1.23%, 23.11±0.86%, 15.17±0.49%, and 6.56±0.50% in dsRNA+siLC3, dsRNA, siLC3, and untreated cells. Significant differences were observed between treated cells and untreated cells (p < 0.05) (Fig. 7A). In addition, the AI were evaluated using the nuclear binding dye Hoechst 33285 (Fig. 7B) and TUNEL by fluorescence microscopy (Fig. 7C). Compared with AI of untreated cells (6±0.34% and 3±0.03%), higher AI was detected in all treated cells (every p < 0.01); however, the highest AI was detected in dsRNA+siLC3 treated cells (41.34±1.21 and 32.43±2.11) compared to both dsRNA treated cells (24.00±1.76 and 14.71±1.02) and siLC3 treated cells (21.82±2.65 and 11.94±1.03) (every p < 0.01).
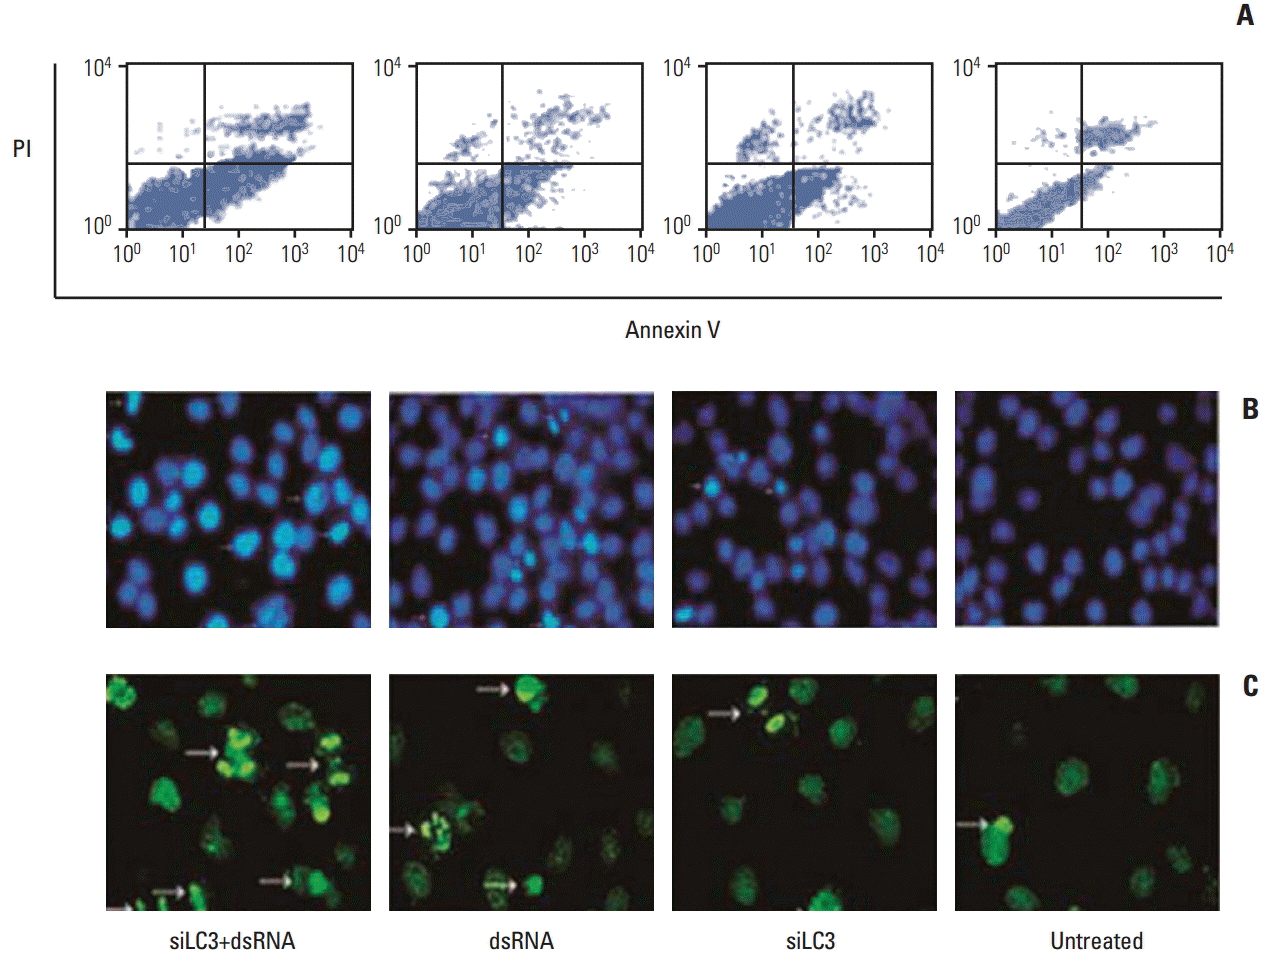
Apoptosis in HepG2 cells detected by flow cytometry (A), Hoechst33285 (B), and terminal deoxynucleotidyl transferase-mediated dUTP-biotin nick end labeling (TUNEL) staining (C) (arrows indicating apoptotic nuclei were bright blue in Hoechst33285 staining, and bright green in TUNEL staining, ×200). PI, propidium iodide; siLC3, siRNA targeted autophagy–related gene LC3.
5. Effects of dsRNA and siLC3 on the growth of xenograft tumors
Tumor growth curves during the entire study period and the xenograft tumor volumes in sacrificed mice showed that xenograft tumor growth was significantly slower and tumor volumes were significantly reduced, in order, siLC3+dsRNA (0.475 mg), dsRNA (0.525 mg), and siLC3 (0.856 mg) compared with PBS controls (1.064 mg) (p < 0.05) (Fig. 8).
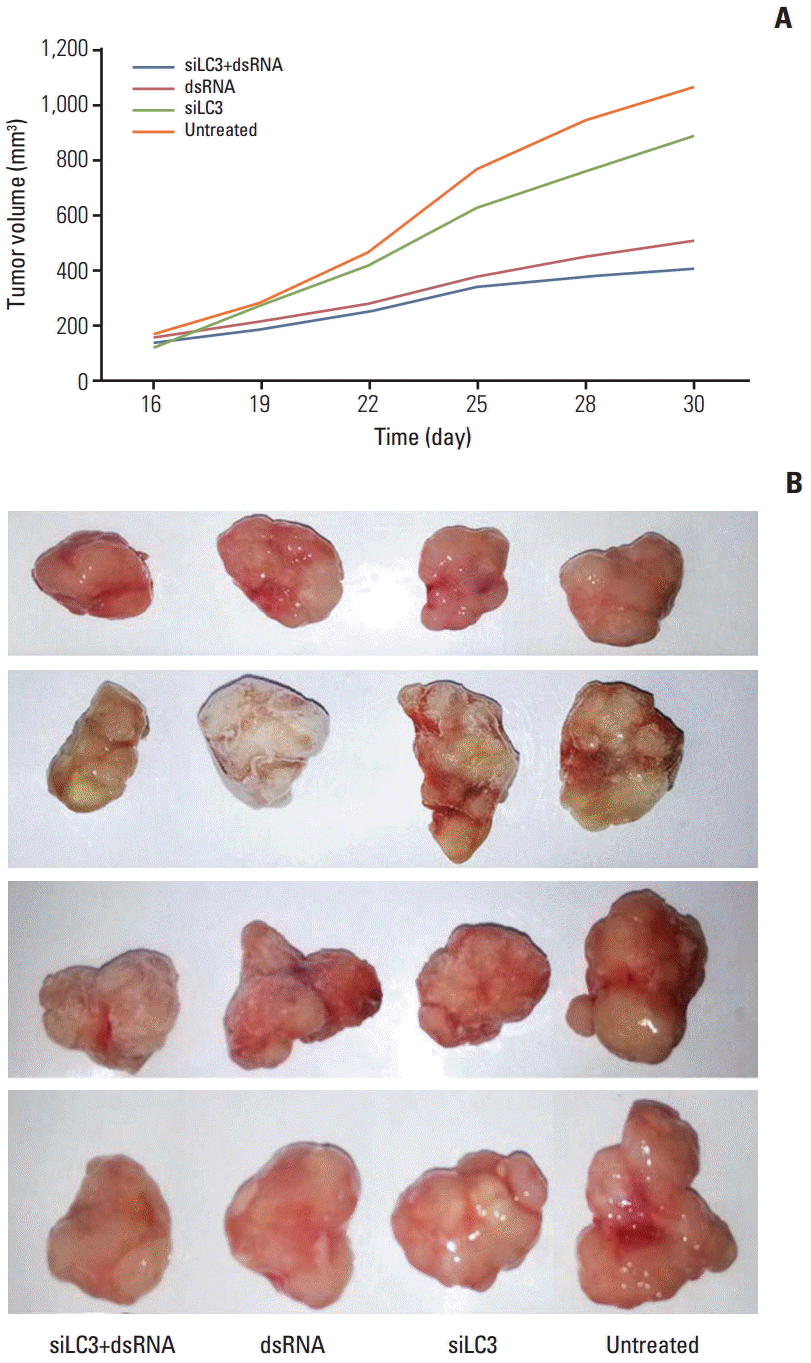
Effects of dsRNAs and siRNA targeted autophagy–related gene LC3 (siLC3) on the xenograft tumor of nude mice. The xenograft tumor growth of nude mice was significantly slower in days (A) and the tumor nodules were significantly smaller after the mice were sacrificed (B) in order siLC3+dsRNA, dsRNA, and siLC3 compared with phosphate buffered saline (PBS) controls. *p < 0.05 vs. the PBS control group.
6. Expression of TLR3, TRIF, and LC3 in xenograft tumors tissues
Expression of TLR3, TRIF, and LC3 in vivo was similar to that in vitro. In addition, TUNEL detection showed that AI was significantly increased in all testing groups in histological sections of tumor, the effect of siLC3+dsRNA was the most prominent (p < 0.05) compared with PBS controls (p < 0.05) (Fig. 9).
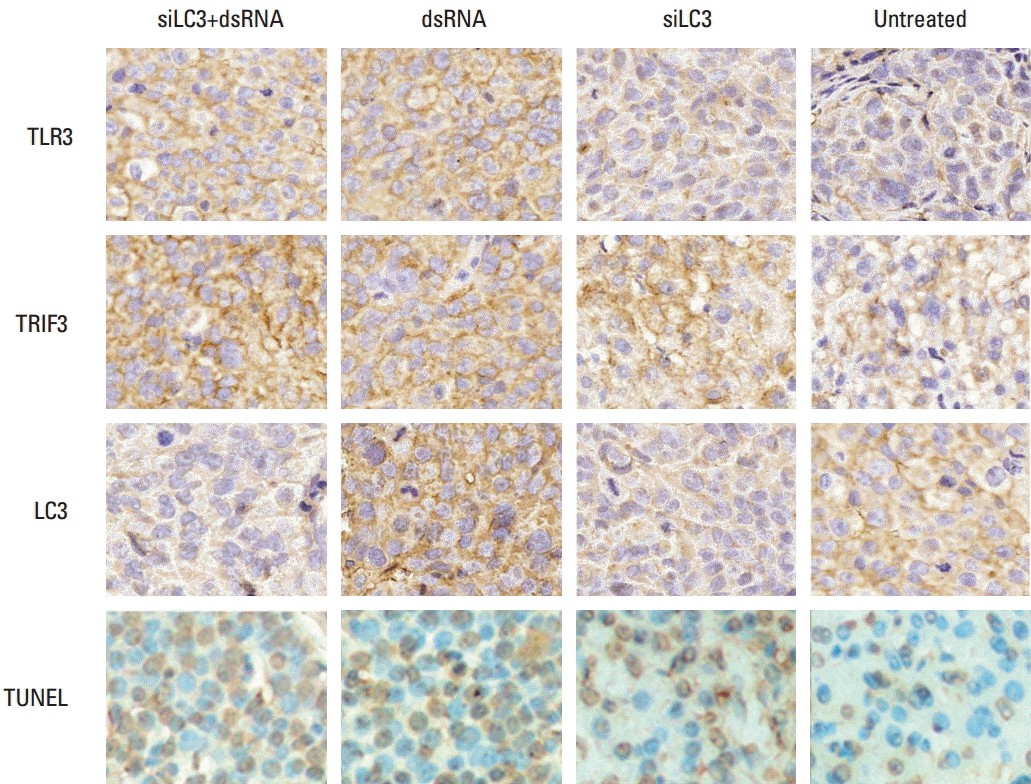
Results of immunohistochemistry and terminal deoxynucleotidyl transferase-mediated dUTP-biotin nick end labeling (TUNEL) detection in xenograft tumor tissues (×400). TLR3, Toll-like receptor 3; TRIF3, Toll–interleukin-1 receptor domain-containing adaptor inducing interferon β; LC3, microtubule-associated protein light chain 3; siLC3, siRNA targeted autophagy–related gene LC3.
Expression of TLR3, TRIF was markedly up-regulated, in order, in the siLC3+dsRNA, dsRNA, and siLC3 treated groups. LC3 was up-regulated in dsRNA, but markedly down-regulated in siLC3+dsRNA and siLC3, respectively, compared with PBS control groups. In TUNEL staining, apoptotic cell nuclei were stained in brownish yellow, while normal nuclei were stained in blue. AI in the cells was obviously increased, in order, siLC3+dsRNA, dsRNA, and siLC3 compared with PBS controls.
7. Effects of dsRNA and siLC3 on angiogenesis in vitro and in vivo
In the tube forming assay, untreated HUVECs formed an organized network of tubes within 24 hours, the average ring number of tube formation was 65±4.3, whereas that for tube formation decreased in siLC3+dsRNA treated cells (7±1.1) and dsRNA treated cells (15±4.2) or siLC3 treated cells (22±2.5) compared with untreated cells (p < 0.01 and p < 0.05). These results indicate that siLC3 and dsRNA had a potential inhibitory effect on angiogenesis (Fig. 10A). The role of dsRNA and siLC3 in angiogenesis of xenograft models was evaluated by blood flow signals under B-model ultrasound diagnosis and CD34-positive microvessels with immunohistochemistry staining. The intratumor blood flow was significantly reduced, in order, in the siLC3+dsRNA, dsRNA, and siLC3 groups compared with PBS controls (p < 0.05) (Fig. 10B). The results observed by CD34 expressing positive microvessels analyses were similar to that in HUVEC tubeformation or B-model ultrasound diagnosis (Fig. 10C).
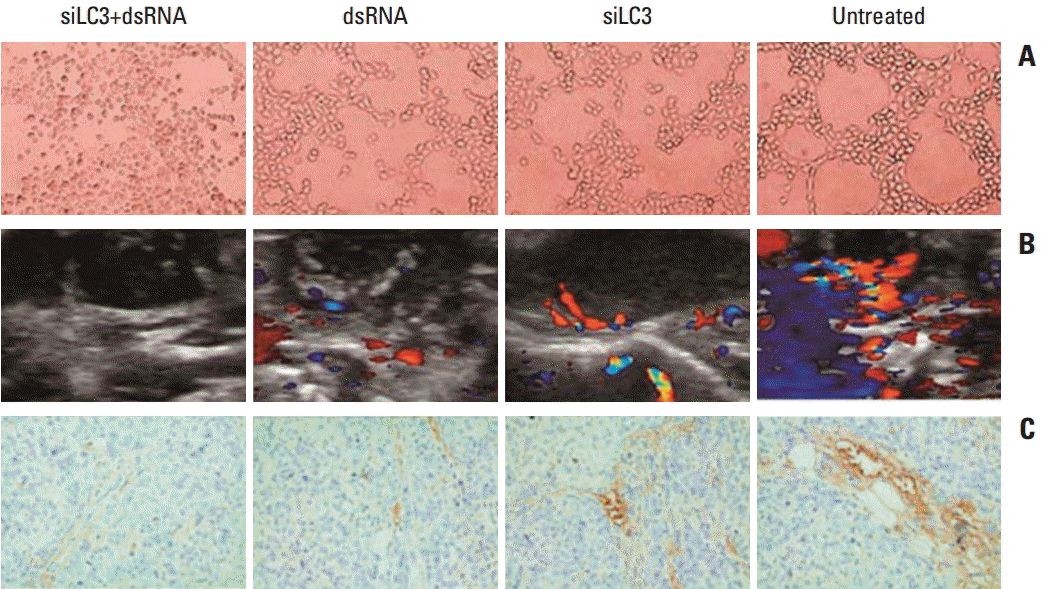
dsRNA and siRNA targeted autophagy–related gene LC3 (siLC3) inhibited angiogenesis in vitro and in vivo. (A) Effects of dsRNA and siLC3 on human umbilical vein endothelial cell (HUVEC) tube-formation (×100). Both dsRNA and siLC3 inhibited the tube formation of HUVECs on matrigel; however, an obvious organized network of tubes was observed in untreated HUVECs. (B) The tumor blood flow changes in B-model ultrasound diagnosis. Compared to the phosphate buffered saline control group with obvious blood flow in tumor and basilar part, blood flow was moderately inhibited in dsRNA and siLC3 alone, while most significantly reduced in siLC3+dsRNA (the red area for flow toward the probe, and the blue area for flow back to the probe). (C) CD34 expressing positive microvessels in immunohistochemistry staining (×400). The results of CD34 expressing microevessels by immunohistochemistry staining were similar to that in HUVEC tube–formation or B-model ultrasound diagnosis.
Discussion
TLR3, a TLR family member, can identify the common intermediate dsRNA in the process of viral replication. TLR3-mediated signaling is critically dependent on TRIF. TRIF–/–lung fibroblasts are defective in poly I:C-induced activation of nuclear factor κB (NF-κB) and IRF3 as well as production of type I IFNs, demonstrating that TRIF is indispensable for TLR3-mediated signaling [18]. In this paper, we first synthesized a dsRNA for transfection of targeting cells; the results showed that dsRNA is used to active TLR3 signaling through upregulation of TLR3 and TRIF.
Nascently, LC3 is processed at its C terminus by Atg4 and becomes LC3-I, which has a glycine residue at the C-terminal end and subsequently conjugates with phosphatidylethanolamine (PE) to become LC3-II (LC3-PE) by a ubiquitination-like enzymatic reaction. Therefore, LC3-II serves as a widely used marker for autophagosomes [11,17]. In this study, siLC3 was constructed and used to inhibit intracellular autophagy levels. The mRNA and protein expression of LC3 was significantly reduced in HCC cells transfected by siLC3, proving the target specificity of siLC3.
Previous studies have demonstrated that TLR3 can directly induce cell apoptosis in human cancer cells [1-5,19], and the influence of autophagy on apoptosis has been studied. The relatively large cytoplasmic volume in human hepatoma cell lines was selected as the experimental object. Compared with the other HCC cell lines, HepG2 cells showed higher mRNA and protein expression of TLR3 and LC3, and were therefore chosen for this study. After transfection, in qRT-PCR and western blotting, elevated mRNA and protein expression of TLR3 and TRIF, respectively, was observed for siLC3+ dsRNA, dsRNA, and siLC3, compared with untreated cells. The characteristics of these protein expressions by immunohistochemistry in xenograft tumors of nude mice were similar to those detected in vitro, indicating that dsRNA and siLC3 can also activate TLR3 signaling pathways. Immunofluorescence staining showed the expression of TRIF and LC3 protein presenting co-localization in cytoplasma of HepG2 cells, in the subcellular structure. The study found that LC3 expression was reduced in association with an increasing TRIF expression in siLC3+dsRNA and siLC3, suggesting that knock down of LC3 expression can reduce the degradation of TRIF, and is more favorable to TLR3 signaling pathways activited by dsRNA. Alhough TLR3 is located in endosomes or phagolysosomes, static TRIF does not bind with TLR3, but with the stimulated ligand poly I:C, which initiates TLR3 signal transduction [20]. Because TRIF cannot co-locate with any of the currently defined endogenous markers, the exact location of TRIF in cells is not yet conclusive. Results of research reported by Biswas et al. [14] showed interaction of ubiquitin related Uba structure domain in ubiquitin protein 1 (ubiquitin 1 or PLIC-1) and TRIF [21]. We found that co-localized expression of TRIF and LC3 protein in cytoplasma of HepG2 cells may be due to the the interaction between TRIF and LC3, thus suggesting a new possibility that TRIF can locate into an autophagosome. Because the recently proposed selective autophagic degradating protein is mediated by an autophagy receptor, to determine whether the TRIF is degradated by a specific autophagy receptor, Inomata etc. [14] using HEK293T cells, examined the question of whether activation of TRIF signaling can be recruited to the selective degradation of TRAF6 and TRIF mediated by autophagy receptor NDP52 and by transfection of NDP52 to HEK293T cells can be weakened by TRIF overexpression induced by activation of NF-κB and IRF3 transcription, these roles of degradation can be reversed through autophagy inhibitor 3-mA. This finding indicates that the TLR3-TRIF signaling protein can be directly degraded by an autophagy receptor.
At the ultrastructural level, an autophagosome is defined as a double-membraned structure containing undigested cytoplasmic contents, which has not fused with a lysosome [22]. It should be noted that the quantitation of relative numbers of autophagosomes observed by electron microscopy can help in reflection of autophagy activation. In this study, autophagosomes were reduced in siLC3+dsRNA and siLC3 treated cells, whereas, only dsRNA stimulation can increase the expression of LC3 leading to increased autophagosomes in cells.
These results indicate that activation of TLR3 by dsRNA in promoting apoptosis can also induce autophagy to strengthen TLR3-TRIF signaling pathways. Perhaps autophagy is not the result of TLR3 activation, but the role of the TLR3 signaling pathway or a bypass procedure [14,21]. Some findings have demonstrated that TLRs utilize the mechanism of autophagy to eliminate intracellular pathogens [15,16]. TLR-activated autophagy is regulated by the interaction of MyD88 or TRIF with Beclin 1, a key factor in autophagosome formation and induction of the interaction by TLR. The interaction of Beclin 1 and TRAF6 can facilitate activation of Beclin 1 and formation of autophagosomes [23]. Shi and Kehrl [23] demonstrated that TLR family members induce autophagy in macrophages, and MyD88 and TRIF co-immunoprecipitate with Beclin-1. While TLR signaling enhances the interaction of MyD88 and TRIF with Beclin-1, it reduces the binding of Beclin-1 and Bcl-2 by recruiting Beclin-1 into the TLR-signaling complex, which leads to autophagy [23]. TLR3 is the only TLR to have TRIF as an adaptor. Xu et al. [11] suggested that the TRIF-RIP1 pathway was essential for autophagy.
Many literature studies have reported that TLR-signaling promoted apoptosis by different signaling pathways, including the extrinsic caspase pathway [3], TLR3–TRIF–NF-κB and STAT-1 pathways [11], survivin-mediated pathways [17], and TRIF-dependent pathway [19]; however, whether or not apoptosis is influenced by autophagy levels, particularly whether or not LC3 is related to apoptosis induced by TLR-signaling is still unclear. In this paper, suppression of cell vitality in siLC3+dsRNA was significantly stronger than in the siLC3 and dsRNA groups. Further cell apoptosis was examined through flow cytometry analysis, Hoechst staining, and TUNEL detection based on cellular and nuclear morphology. In the results, apoptotic cells were more obvious, in order, in siLC3+dsRNA, dsRNA, and siLC3 treated cells, demonstrating that dsRNA and siLC3 might induce apoptosis of HepG2 cells. In observation of xenograft tumors of nude mice in vivo, tumor growth curves during the entire study period indicated marked inhibition of tumor growth, in order, siLC3+dsRNA, dsRNA, and siLC3, compared with PBS controls. In TUNEL detection, the results showing increased AI also proved that cell apoptosis was significantly higher in the siLC3+dsRNA group than in the other two groups. Similarly, as expected, reduced HUVEC cell vitality and increasing apoptosis resulted in significantly inhibited tube formation of HUVECs cultured in the above described experimental cell culture supernatant, and the intratumor-blood flow under B-model ultrasound diagnosis as well as CD34-positive microvessels by immunohistochemistry in siLC3+dsRNA, dsRNA, and siLC3 transfecting cell culture supernatant treated HUVECs and its stabilizing transfecting cells in xenograft tumors of nude mice. These results show that the expression of LC3 increases in HepG2 cells, HUVEC cells, and xenograft tumors, respectively, treated with dsRNA, suggesting that downregulation of LC3 by siLC3 can also promote dsRNA induced apoptosis in HepG2 cells. It was confirmed that the reduction of autophagosomes by siLC3 may lead to decreased degradation of TRIF protein. Therefore, siLC+dsRNA induced apoptosis of HepG2 cells by two pathways, the TLR3-TRIF-caspase pathway and autophagy pathway. On the one hand, apoptosis was triggered by dsRNA directly via the TLR3-TRIF-caspase pathway, on the other hand, inhibition of autophagy resulted in decreased degradation of TRIF protein, indirectly promoting apoptosis. Depending on the multistep characteristics of the TLR3 signal pathway, siLC+dsRNA could act as a molecular on-off switche to completely turn on a TLR3-TRIF-caspase cellular process while turning off the autophagy cellular process, so that autophagy receptors cannot degrade the TRIF protein, leading to increased apoptosis. These results indicated that reduction of autophagy by siLC3 might reinforce TLR3-TRIF-mediated apoptosis resulting in inhibited growth of nude mice tumors. It is suggested that inhibition of the autophagic signaling molecule LC3 in manipulation of TLR3-TRIF expression levels might increase sensitivity of cell apoptosis. Our studies have highlighted the pivotal regulatory roles of siLC+dsRNA in apoptotic signaling pathways, with substantial evidence demonstrating that inhibition of autophagy causes apoptosis [24]. Therefore, it is reasonable to envision a role for inhibitiion of autophagy to strengthen TLR3-TRIF apoptotic signaling pathways.
Conclusion
In this study, we report that autophagy is associated with apoptosis processes, involving LC3 and TRIF-colocation in human HCC cells. Regulation of autophagy and the TLR3-TRIF pathway may be effective in the treatment of liver cancer. These findings provide a better understanding of the development of therapeutic approaches based on dsRNA-modulating agents in combination with siLC3 via activity of the TLR3-TRIF molecule signaling pathway to strengthen the occurrence of apoptosis. Future work is required for detailed exploration of this novel mechanism.
Notes
Conflict of interest relevant to this article was not reported.
Acknowledgements
This study was supported by the foundation of the production-study-research prospective joint research programs of Jiangsu Province, China (BY 2013042–06), a project funded by the Priority Academic Program Development of Jiangsu Higher Education Institutions (PAPD), the Science Foundation of Nantong City, Jiangsu Province, China (No. BK2014001, HS2014004), the Science Foundation of Jiangsu Higher Education Institutions (14KJB310016) and graduate science, and technology innovation project of Nantong University (ykc15050).