Concurrent Chemoradiotherapy Versus Chemotherapy Alone for Unresectable Locally Advanced Pancreatic Cancer: A Retrospective Cohort Study
Article information
Abstract
Purpose
The optimal treatment strategy for locally advanced pancreatic cancer (LAPC), particularly the role of concurrent chemoradiotherapy (CCRT), remains debatable. We compared the clinical outcomes of CCRT and palliative chemotherapy alone (CA) in patients with unresectable LAPC.
Materials and Methods
Patients with LAPC who were consecutively treated between 2003 and 2010 were included. Resectability was evaluated according to National Comprehensive Cancer Network ver. 1.2012. The clinical outcomes for each treatment group (CCRT vs. CA) were evaluated retrospectively.
Results
Sixty-three patients (58.9%) and 44 patients (41.1%) were treated with CCRT and CA, respectively. The CCRT cohort included patients who were treated with CCRT with or without chemotherapy backbone (CCRT alone, induction chemotherapy-CCRT, CCRT-maintenance chemotherapy, and induction-CCRT-maintenance chemotherapy). Median progression-free survival (PFS) and overall survival (OS) of all patients were 7.2 months and 13.1 months. PFS of the CCRT and CA groups was 9.0 months and 4.4 months, respectively (p=0.020). OS of the CCRT and CA groups was 15.4 months and 9.3 months, respectively (p=0.011). In multivariate analysis, the adjusted hazard ratio of CCRT was 0.536 (p=0.003) for OS and 0.667 (p=0.078) for PFS. Although the pattern of failure was similar in the CCRT and CA groups, the times to both local and distant failure were significantly longer in the CCRT group.
Conclusion
In patients with unresectable LAPC, those who underwent CCRT during their entire treatment courses had longer OS than patients treated with chemotherapy alone.
Introduction
Pancreatic cancer (PC) is the fourth most common cause of cancer death in both Asian and western countries [1]. At the time of diagnosis, less than 20% of patients are eligible for curative surgery [2]. Among patients with initially inoperable PC, approximately 30% of patients present with locally advanced disease without distant metastasis [3]. PC has a dismal prognosis, with a 5-year overall survival (OS) rate of 5% [4].
The optimal treatment strategy for locally advanced pancreatic cancer (LAPC) is still controversial, and the role of local control by concurrent chemoradiotherapy (CCRT) has not been established. Most clinical trials in the setting of palliative chemotherapy in PC have included both LAPC patients and metastatic PC patients, altogether, and used the extent of disease as a stratification factor.
The superiority of CCRT to radiation alone was proven in 1981 [3]. Although the Gastrointestinal Tumor Study Group (GITSG) reported a higher efficacy of CCRT than chemotherapy alone (CA) in the 1980’s, the superiority of CCRT and CA continues to be debated [5,6]. After the introduction of gemcitabine for treatment of advanced PC, treatment with gemcitabine alone resulted in longer survival than 5-fluorouracil (5-FU) based CCRT followed by maintenance gemcitabine (13 months vs. 8.6 months) in the FFCD-SFRO trial [7].
In contrast, in treatment with gemcitabine plus radiation longer survival was achieved compared to gemcitabine alone (11.1 months vs. 9.2 months) in the ECOG E4201 trial [8].
Induction chemotherapy prior to CCRT was introduced for achievement of both systemic and local control of possible unrecognized micro-metastases and to effectively identify the patients who might benefit from CCRT after induction chemotherapy [9,10].
The introduction of new radiosensitizing agents with advanced radiotherapy techniques reduced toxicities; however, consensus regarding efficacy is still elusive [11,12]. Gemcitabine was reported to be a more potent radiosensitizer than 5-FU [13], and better outcomes were reported for capecitabine, another radiosensitizer, than gemcitabine [14]. However, those findings are insufficient to support a general consensus regarding the optimal treatment for LAPC.
Therefore, this study was conducted to evaluate the effects of adding CCRT to a chemotherapy backbone in LAPC.
Materials and Methods
1. Study patients
LAPC patients who were consecutively treated between 2003 and 2010 were included. Eligible patients had (1) histologically confirmed pancreatic adenocarcinoma, (2) no radiographic evidence of distant metastases, and (3) radiographic evidence of unresectability.
All computed tomography/magnetic resonance imaging image were reviewed for the unresectability, following the guidelines for LAPC of the National Comprehensive Cancer Network (NCCN) ver. 1.2012 [15]. Tumors met the criteria: tumors invaded or encased the aorta or encased the celiac axis or superior mesenteric artery by more than 180˚ (abutted celiac axis at any degree in pancreatic head cancer) or demonstrated unreconstructable occlusion of the superior mesenteric vein or portal vein or extended to lymph nodes beyond the field of resection.
2. Study methods
1) Treatment cohort
Patients who underwent CA during the entire treatment course were included in the CA group. Patients who underwent CCRT during the entire treatment course were included in the CCRT group.
2) Response evaluation
Objective tumor response was evaluated according to the Response Evaluation Criteria In Solid Tumors (RECIST) ver. 1.1.
Body mass index (BMI) was calculated as body weight divided by height2 (kg/m2) measured the day of the first dose of chemotherapy. Tumors were staged according to the American Joint Committee on Cancer (AJCC) seventh edition.
3. Statistical analysis
OS, progression-free survival (PFS), best response, pattern of failure, and toxicities were evaluated according to treatment groups. OS was defined as the period from the start of treatment to death from any cause. PFS was defined as the period from the start of treatment to the progression of disease or death from any cause, with censoring of patients who are lost to follow-up.
The median OS and PFS were calculated using the Kaplan-Meier method. Between-group differences in demographic and clinical data were evaluated using Fisher exact test for categorical variables. The effect of multiple factors on survival, the hazard ratio (HR) and its 95% confidence interval (CI) were evaluated using Cox proportional hazards models. Each variable that was likely to be associated with survival, based on p ≤ 0.1 in the univariate analysis, was evaluated in the multivariate analysis. The survival of the two groups was compared using the log-rank test. All tests were 2-sided, and p ≤ 0.05 was considered statistically significant. Statistical analyses were performed using SPSS ver. 19.0 (IBM Co., Armonk, NY).
4. Ethics
This study was reviewed and approved by the Institutional Review Board of Seoul National University Hospital (IRB No. H-1307-146-507). All studies were conducted according to ethical guidelines (Declaration of Helsinki) for biomedical research.
Results
1. Patient characteristics
A total of 107 patients with LAPC were identified retrospectively; their characteristics by treatment groups are shown in Table 1. The median age was 60.7 years (range, 35.2 to 84.0 years) and most patients (88.8%) had a performance status of 0 or 1. Thirty-one patients (29.0%) had T3 lesions and 76 patients (71.0%) had T4 lesions, and 45 patients (42.1%) had positive lymph nodes. Primary tumor sites were equally distributed in the head (51.4%) and body (48.6%) of the pancreas. Seventy-three patients (68.2%) had primary tumors larger than 3 cm. BMI distributions were BMI < 20.0 (29.0%); 20.0 ≤ BMI < 25.0 (57.0%); and BMI ≥ 25.0 (14.0%).
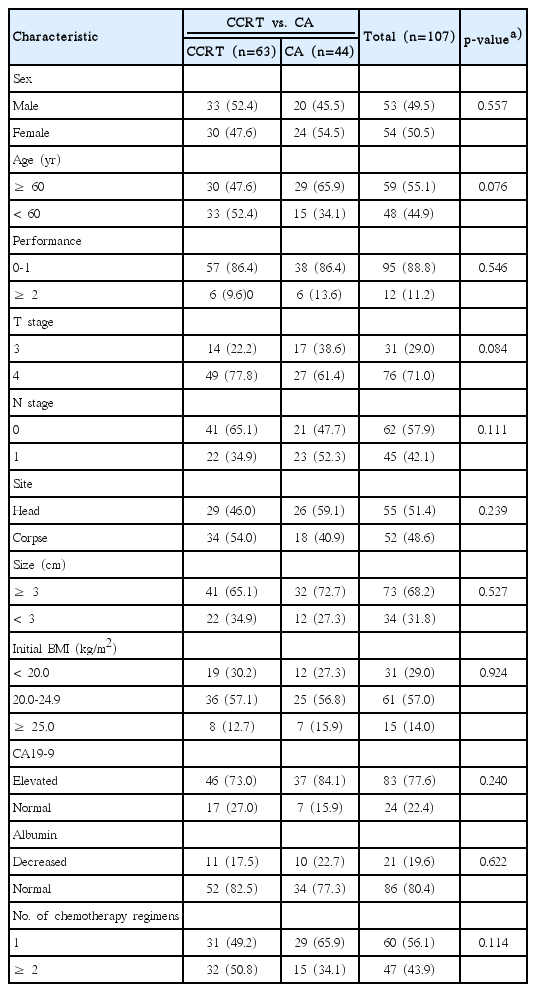
Clinical characteristics by treatment groups
2. Treatment regimen
Flow diagram for the study cohort is shown in Fig. 1 and treatments are summarized in Table 2. Sixty-three patients (58.9%) underwent CCRT and 44 patients (41.1%) underwent CA.
Flow diagram for the study cohort. LAPC, locally advanced pancreatic cancer; CCRT, concurrent chemoradiotherapy, CA, chemotherapy alone.

Details of treatment regimens
1) CCRT cohort
(1) Induction chemotherapy
Among the CCRT group, 36 patients (57.1%) received a median of three cycles of induction chemotherapy (range, 1 to 9) prior to CCRT. The most commonly selected induction agents were gemcitabine-based doublets.
(2) CCRT
The prearranged total dose was 55.8 Gy/31 fractions delivered five times weekly, composed of 45 Gy/25 fractions delivered to the entire region and 10.8 Gy/6 fractions as a booster. Most patients (n=56, 88.9%) received a radiation dose ≥ 50 Gy. Median total delivered radiation dose was 55.8 Gy (range, 32.4 to 59.4 Gy) delivered as 1.8 Gy per fraction (range, 1.6 to 2.0 Gy) over 6 weeks (median, 6.1 weeks; range 2.6 to 8.1 weeks). Radiosensitizers used during CCRT were gemcitabine (n=17, 27.0%), 5-FU (n=16, 25.4%), and capecitabine (n=30, 47.6%).
(3) Maintenance chemotherapy
Patients without progression after CCRT received additional maintenance chemotherapy (n=44, 69.8%) using a median of three cycles (range, 1 to 17 cycles). The most frequently used maintenance chemotherapy agents were also gemcitabine-based regimens (n=38, 86.3%).
2) CA cohort
Among the patients in the CA group, gemcitabine-based regimen was used in 97.7% of patients. Median chemotherapy cycle and dose intensity were three cycles (range, 1 to 18 cycles) and 100% (range, 60% to 100%), respectively.
The baseline characteristics showed a similar distribution in the CCRT and CA groups (Table 1).
3. Treatment outcomes
The median duration of follow-up for all patients was 12.6 months (range, 2.0 to 58.3 months), and the median OS and PFS were 13.1 months (95% CI, 11.6 to 14.6 months) and 7.2 months (95% CI, 6.2 to 8.3 months), respectively. Two patients who underwent CCRT after first-line failure were excluded from the analysis of PFS for first-line treatment.
4. Outcomes analysis by treatment group
First-line treatment outcomes of CCRT and CA groups are summarized in Table 3.

Response to first-line treatment
1) Response
In the CCRT group, three patients (4.9%) had complete response (CR), 18 (29.5%) had partial response (PR), and 37 (60.7%) had stable disease (SD). In the CA group, one patient (2.3%) had CR, seven (15.9%) had PR, and 18 (40.9%) had SD.
2) OS
The median OS was 15.4 months (95% CI, 13.2 to 17.6 months) in the CCRT group and 9.3 months (95% CI, 6.6 to 12.0 months) in the CA group (p=0.011) (Table 4, Fig. 2A). The 1-year OS was 69.1% in the CCRT group and 37.9% in the CA group. The median OS of patients who underwent CCRT alone, induction-CCRT, CCRT-maintenance, and induction-CCRT-maintenance was 10.9 months (95% CI, 6.4 to 15.4 months), 9.2 months (95% CI, 1.7 to 16.8 months), 17.0 months (95% CI, 14.3 to 19.8 months), and 17.0 months (95% CI, 15.1 to 18.9 months), respectively (p=0.010). CCRT with induction chemotherapy did not differ significantly from CCRT without induction chemotherapy in OS (16.4 months vs. 13.6 months; HR, 0.840; 95% CI, 0.492 to 1.435; p=0.524). However, CCRT with maintenance chemotherapy resulted in significantly longer OS than CCRT without maintenance chemotherapy (17.0 months vs. 9.2 months; HR, 0.449; 95% CI, 0.251 to 0.801; p=0.007).

Summary of response and survival by treatment groups
Overall survival (OS) and progression-free survival (PFS) by first-line treatment modality. (A) Median OS was 15.4 months (95% confidence interval [CI], 13.2 to 17.6 months) in the concurrent chemoradiotherapy (CCRT) group and 9.3 months (95% CI, 6.6 to 12.0 months) in the chemotherapy alone (CA) group (p=0.011). (B) Median PFS was 9.0 months (95% CI, 7.0 to 11.0 months) in the CCRT group and 4.0 months (95% CI, 1.6 to 6.3 months) in the CA group (p=0.010).
3) PFS
The median PFS was 9.0 months (95% CI, 7.0 to 11.0 months) in the CCRT group and 4.4 months (95% CI, 0.9 to 8.0 months) in the CA group (p=0.020). Six-month PFS was 68.3% and 47.4% and 1-year PFS was 28.6% and 13.1%, respectively (Table 4, Fig. 2B). The PFS of patients who underwent CCRT alone, induction-CCRT, CCRT-maintenance, and induction-CCRT-maintenance was 3.0 months (95% CI, 2.3 to 3.7 months), 5.3 months (95% CI, 4.5 to 6.1 months), 6.9 months (95% CI, 2.4 to 11.5 months), and 11.4 months (95% CI, 10.2 to 12.7 months), respectively (p < 0.001). The use of induction and maintenance chemotherapy prolonged PFS (10.8 months vs. 4.7 months; HR, 0.449; 95% CI, 0.261 to 0.773; p=0.004) and (10.8 months vs. 4.5 months; HR, 0.322; 95% CI, 0.177 to 0.585; p < 0.001), respectively. Only one patient in the CCRT group converted to resectability, underwent margin-negative resection after CCRT, and had an OS of 17.0 months and PFS of 6.9 months.
4) Patterns of failure
The pattern of progression (local failure and/or distant metastasis) is shown in Table 4. Among assessable patients, the frequency of local failure, with or without distant progression, did not differ; 54.9% and 58.6% in the CCRT and CA groups, respectively (p=0.817). However, median time to local progression was longer, by 6.8 months, in the CCRT group than in the CA group (p < 0.001). The frequency of systemic failure, with or without local progression, was also similar, 58.8% in the CCRT group and 58.6% in the CA group (p=1.000). Median time to distant progression was also longer, by 2.8 months, in the CCRT group than in the CA group (p=0.001) (Table 4). However, in comparison of the CCRT alone and CA groups, no significant difference was found in survival and pattern of failure (OS: HR, 0.880; p=0.718; time to local failure: HR, 1.255; p=0.665; time to systemic failure: HR, 0.749; p=0.654). In all patients, the most frequent sites of distant failure were liver (30.9%), peritoneum (27.2%), and lung (12.3%).
5. Analysis of prognostic factors
Table 5 shows the results of the analysis of possible prognostic factors for OS. In the univariate analysis, BMI (p=0.021), CCRT (p=0.011), carbohydrate antigen 19-9 (CA19-9) (p=0.007), and albumin (p < 0.001) showed significant association with OS. In the multivariate analysis, elevated CA19-9 (HR, 1.877; 95% CI, 1.077 to 3.272; p=0.026) and decreased albumin levels (HR, 3.148; 95% CI, 1.863 to 5.320; p < 0.001) conferred a higher risk for death, whereas CCRT (HR, 0.536; 95% CI, 0.355 to 0.809; p=0.003) significantly lowered the risk.

Analysis of potential prognostic factors for overall survival
In the univariate analysis, the significant prognostic factors for PFS were T stage (p=0.001), N stage (p=0.021), initial BMI (p=0.030), and CCRT (p=0.020). In the multivariate analysis, T4 (HR, 0.504; 95% CI, 0.308 to 0.825; p=0.006), positive lymph node (HR, 1.664; 95% CI, 1.049 to 2.639; p=0.030), and normal range of initial BMI (HR, 0.590; 95% CI, 0.350 to 0.995; p=0.048) showed association with PFS. CCRT (HR, 0.667; 95% CI, 0.426 to 1.046; p=0.078) and decreased albumin (HR, 1.662; 95% CI, 0.931 to 2.969; p=0.086) tended to showed association with longer and shorter PFS, respectively (Table 6).
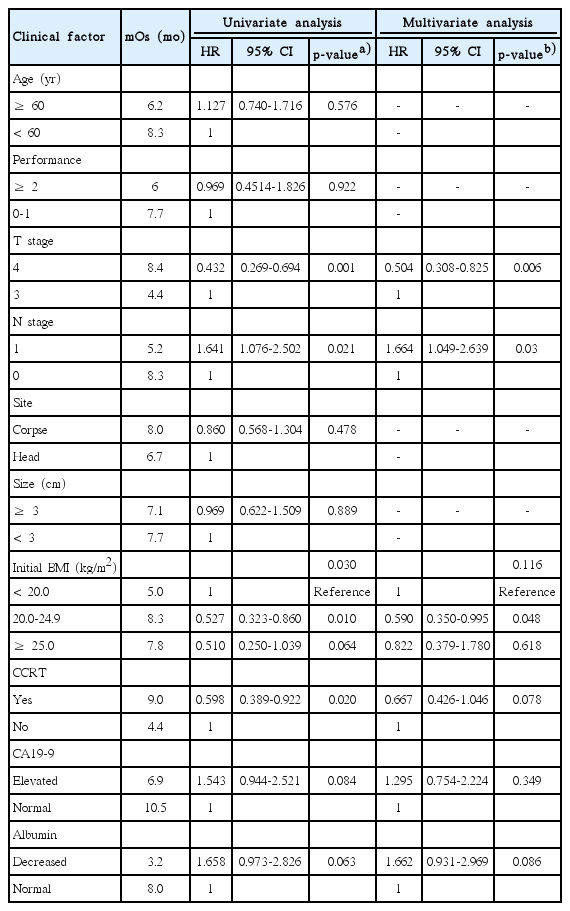
Analysis of potential prognostic factors for progression-free survival
Discussion
The question of whether CCRT or CA is superior for LAPC has been debated for decades. In this study, we demonstrated an advantage of CCRT. Using multivariate analysis, we found that addition of CCRT in the chemotherapy backbone had excellent prognostic implications for treatment of LAPC patients. Further examination showed that better outcomes could be achieved by sequential treatment of CCRT-maintenance chemotherapy.
In addition, although the CCRT and CA groups showed similar patterns of failure, time to distant progression and to time to local progression were also significantly longer in the CCRT group.
Previous clinical trials focusing on combined radiosensitizers have reported conflicting results. Although gemcitabine was reported to be a more potent radiosensitizer than 5-FU [13], these results were inconsistent [11,16]. In the SCALOP trial, the use of capecitabine, a radiosensitizer, resulted in a better outcome than gemcitabine [14]. However, further controlled trials comparing the efficacy of radiosensitizers are needed.
For more than 30 years, many studies have investigated the optimal treatment of LAPC. Some studies supported the superiority of CCRT over CA [5,8,9], but others did not agree with CCRT’s superiority [7,17]. In this study, longer OS was observed with CCRT than with CA and longer PFS by use of an induction and/or maintenance chemotherapy backbone in the CCRT regimen. Of note, the median PFS of patients treated with CCRT alone was only 3.0 months. In previous studies of LAPC, the use of CCRT after disease control with induction chemotherapy prolonged both OS and PFS [9,18]. These findings support the hypothesis that combined chemotherapy can suppress distant metastases caused by early micro-metastases [19]. Based on analysis of a subgroup of patients of the LAP07 trial, a recent report showed that detection of circulating tumor cells (CTCs) for evaluation of micrometastatic disease was a promising prognostic tool. CTC positivity at baseline and/or at 2 months was associated with a shorter survival (p=0.01) [10].
Among the treatment modalities for PC, resection with a negative margin provides the most favorable prognosis. Because some studies reported their experience with R0 resection in LAPC patients, after pre-operative CCRT allowed down-staging, interest in the neoadjuvant role of CCRT for patients with LAPC and borderline resectable pancreatic cancer (BRPC) patient is increasing [20].
We observed that CCRT, when added to a combined chemotherapy backbone, is clearly beneficial for LAPC patients. We demonstrated that maintenance chemotherapy lengthened both OS and PFS, but we could not prove the efficacy of induction chemotherapy.
The strengths of this study were (1) only initially unresectable LAPC patients were included. BRPC patients with a higher possibility of R0 resection and better prognosis were excluded. (2) We avoided possible confounding by FOLFIRINOX, which is the most powerful first-line treatment regimen and has no credible efficacy data as second-line treatment. The limitations of this trial originated from the retrospective design. We could not obtain reliable data on toxicities.
Conclusion
In conclusion, our study strongly suggests that strengthening the early treatment by addition of CCRT in the chemotherapy backbone during treatment of LAPC patients conferred better treatment outcomes. Further controlled trials are warranted to evaluate the role of CCRT and the efficacy of combined agents.
Notes
Conflict of interest relevant to this article was not reported.