Dental Anomalies as Late Adverse Effect among Young Children Treated for Cancer
Article information
Abstract
Purpose
The aim of this study was to compare the incidence of dental complications in childhood cancer survivors with that of healthy control subjects, and to determine the possible influence of various factors associated with patient and treatment.
Materials and Methods
Sixty-one panoramic radiographs of the dentition of cancer survivors were compared with 521 radiographs of healthy patients at a similar age, between 5 and 18 years. The mean period from termination of therapy was 4.9 years (58.9±34.3 months), and 51 children (83.60%) were under age 5 when therapy began.
Results
Dental anomalies were found in 38 cancer survivors (62.29%) and 69 control subjects (13.24%) (p < 0.001). Agenesis of teeth was found in 19 cancer patients (31.14%) and in 48 control subjects (9.21%). Microdontic teeth were found in 22 cancer survivors (36.06%) and 15 control subjects (2.87%) (p < 0.001), whereas teeth with short roots were found in seven cancer patients (11.47%) and 15 control subjects (2.87%) (p < 0.01). Dental anomalies in cancer patients were more common in some tooth groups and were not observed in others. The frequency of dental anomalies did not show correlation with age at the beginning or termination or time of therapy.
Conclusion
Children under the age of 5 are in a high risk group for dental complications after anticancer treatment. Rudimentary chemotherapy has a considerable impact on the occurrence of dental anomalies.
Introduction
The significantly improved results achieved in anticancer treatment in children have led to an increased number of survivors. However, studies show that up to 40% of these children suffer from serious late complications, including heart failure, neurotoxicity, nephrotoxicity, growth impairment, hormonal disorders, and secondary cancers. Late complications not only seriously impair the patients’ quality of life and cause higher rates of hospitalization, but in 15% of cases, they become the direct cause of the patient’s death [1,2].
Although dental problems in childhood cancer survivors do not appear to be a life-threatening complication of anticancer treatment, they can seriously impair the quality of life of teenagers and young adults. Treatment with cytostatic drugs can lead to a higher incidence of caries, lesions of the enamel, discoloration of teeth or even early loss of teeth requiring usage of dental prosthesis [3]. It can also disturb odontogenesis, resulting in a lack of tooth buds, microdontia or shortening of tooth roots. Radiotherapy of head and neck region and some anticancer drugs, including busulfan, cyclophosphamide, vincristine, actinomycin D, doxorubicin, and daunorubicin, may be particularly significant in the development of dental complications [4-10]. Although few reports have addressed the long-term effects of anticancer treatment on the development of teeth in humans, it can be concluded that disturbances in teeth may appear in as many as all late cancer survivors [11]. Considering the sequence of dental calcification and development, young children seem to be at the highest risk of dental complications resulting from anticancer treatment.
The aim of the current study was to determine the possible influence of age at the time of cancer diagnosis, anticancer therapy, and subsequent application of radiotherapy to the head or neck region on the prevalence of dental anomalies in children. The study compares the incidence of dental complications in childhood cancer survivors with that observed in healthy control subjects.
Materials and Methods
The children included in the dental examination were patients of the Department of Pediatrics, Oncology, Hematology and Diabetology, Clinical Hospital No. 4 of the Medical University of Łódź. All were included in a program for assessment of late side effects of anticancer treatment in survivors of childhood cancers. Dental examination was performed in the Department of Pediatrics and Orthodontics of the Institute of Dentistry of the Medical University of Łodź. The study was approved by the Ethical Committee of the Medical University of Łódź (IRB No. RNN/37/13/KE). Written informed consent for dental and panoramic examinations was obtained from both parents or guardians and patients above the age of 16.
From July 2012 to April 2014, 66 patients underwent dental examinations. Regarding the panoramic radiography examination, parental consent was not given for three patients and two others were excluded from the investigation because of their very young age (2 and 3 years). In total, 61 patients were examined: 17 girls (27.87%) and 44 boys (72.13%). At the time of the examination, the patients were aged between 5 and 18 years (56-213 months). At the beginning of anticancer therapy, the age of the youngest child was 1 month and the oldest 16.3 years (196 months). On average, anticancer therapy lasted 18.4 months (range, 1 to 47 months), and 4.9 years (range, 8 to 147 months) had passed since the termination of disease. The age structure is shown in Table 1.
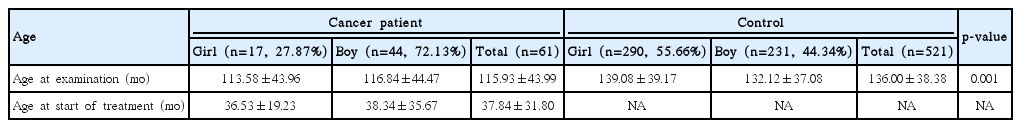
Distribution of sex and age
The children in the study group had been treated for acute lymphoblastic leukaemia, acute non-lymphoblastic leukaemia, B-cell non-Hodgkin lymphoma, Hodgkin lymphoma, germinal tumour, brain tumour, Wilms tumour, hepatoblastoma, neuroblastoma, primitive neuroectodermal tumour, or rhabdomyosarcoma. A detailed prevalence is shown in Table 2.
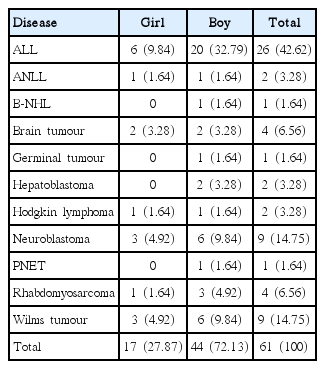
Distribution of diseases among cancer patients
The control group consisted of healthy patients at the Institute of Dentistry with similar age, between 5 and 18 years (range, 56 to 216 months), whose dentition was examined by panoramic radiograph in 2013. From a list of 637 panoramic radiographs, 41 were rejected because of the presence of a cleft lip or palate, 35 for other congenital disorders or advanced dental treatment, and another 40 radiographs had been performed on cancer patients. Finally, 521 children were approved for examination: 240 were patients of the Orthodontics Department and the remaining 281 of other clinics in the Institute of Dentistry.
The panoramic radiographs were analyzed to determine the number of permanent teeth present, changes in the size of the tooth crown or the root structure. The analysis was performed twice, by two independent operators (P.P. and A.S.). Any discrepancy was discussed until agreement was reached.
In analyzing the number of permanent teeth, the children were divided into three groups: patients with one missing tooth, patients with 2-5 missing teeth, and patients with six or more missing teeth (oligodontia). The third molars were excluded because of the young age of the patients.
As no precise criteria could be found for recognition of microdontic teeth, microdontia was recognized only when a tooth was half the size of a comparable homologue [11,12]. If no such tooth could be found, it was compared with the size of a tooth of the same class. The group was divided into patients with one microdontic tooth and those with more than one. Third molars were included in the analysis.
In analysis of the prevalence of disturbances in root development, root shortage was confirmed if the root/crown length ratio was lower than 1.6 (according to a simplified Hölttä Defect Index) [13]. The ratio was estimated only in teeth with completed root development.
The influence of duration of therapy on the development of tooth buds was analyzed. The study group included 61 patients, with four teeth in each group (two upper and two lower), making 244 teeth in each class of tooth. The control group included 2,084 teeth, i.e., 521 patients multiplied by four teeth in each group.
For comparison between the cancer and control groups, dental anomalies were graded from less to most advanced as follows: healthy, teeth with short roots, presence of one microdontic tooth and more than one microdontic tooth, one missing tooth, two to five missing teeth, and oligodontia (6 or more teeth missing). If the individual had more than one abnormality, the patient was included in a group with the more severe one.
1. Statistical methods
Differences in clinical variables were evaluated using the chi-square test or Fisher exact test for qualitative variables and Mann-Whitney U-test or Kruskall-Wallis test for quantitative variables, as appropriate. Spearman’s correlation coefficient was used to evaluate the correlation between quantitative variables.
In addition, to adjust for the potential effect of age on the incidence of teeth with short roots, the control and study groups were matched using a propensity score. Initially, logistic regression was used to rank the patients according to propensity scores. This regression, calculated according to age and sex, was based on the probability of being in the cancer or control groups. The three most closely-related control subjects with regard to propensity score were matched to each cancer patient. This process resulted in the creation of a sex- and age-matched control group of 183 individuals.
All analyses were performed using Statistica Software ver. 10.0 (Statsoft Inc., Tulsa, OK), and a p-value of < 0.05 was considered statistically significant.
Results
In the cancer group, 19 patients (31.14%) had agenesis of 69 tooth buds, 22 (36.06%) had 77 microdontic teeth, and seven (11.47%) had teeth with short roots. In the control group, 48 patients (9.21%) lacked 91 tooth buds, 15 (2.87%) had 20 microdontic teeth, and 15 (2.87%) had 36 teeth with short roots.
In the study group, agenesis was found most often in second premolars and second molars, while in the control group, second premolars and lateral incisors were most often missing. In comparison of the two groups, an increased prevalence of tooth agenesis was found in cancer survivors in the central incisors, second premolars, and first and second molars (p < 0.001) (Table 3).
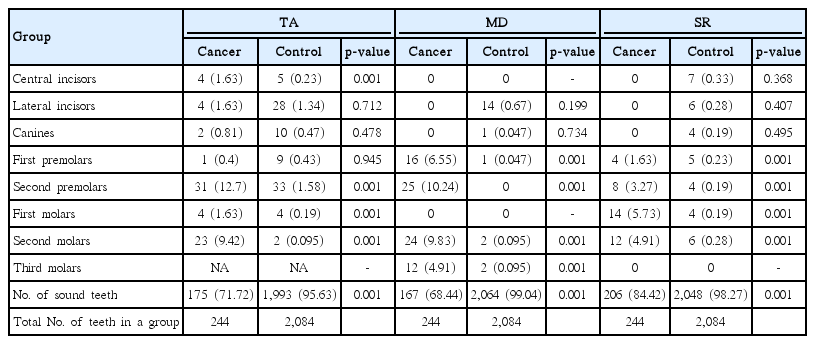
Distribution of teeth with anomalies
Microdontic teeth were most often found among second premolars and second molars in cancer survivors, and among second incisors in control subjects. In comparison of the prevalence of abnormality between two groups, in cancer patients, microdontic teeth were found more often among first and second premolars and second and third molars (p < 0.001). In the study group, teeth with short roots were most often found among the first and second molars. Teeth with short roots were almost equally distributed between all classes of teeth in the control group, but were most often found in the lateral or central incisors and first molars. In cancer survivors, teeth with short roots were significantly more common among first and second premolars and first and second molars (p < 0.001). As observed in the entire study group, a comparison of a sex- and age-matched control group of 183 individuals based on matching propensity scores revealed that the frequency of teeth with short roots was greater in patients with cancer than in control subjects (data not shown).
A statistically significant difference in the prevalence of patients free from abnormalities was found between cancer and control groups: 23 (37.70%) versus 452 (86.76%) (p < 0.001). As a rule, in the study group, the number of patients with various kinds of dental anomalies was higher than among control subjects (Table 4).

Number of patients with dental anomaly, the most severe being recorded
Occurrence of more than one abnormality in a single patient was not very common (Tables 5 and 6). In the group of cancer patients, 10 patients had more than one abnormality (16.39%): nine had both missing and microdontic teeth and one child had microdontic teeth and teeth with short roots. In the control group, nine children had more than one abnormality (1.72%): eight of whom had both missing and microdontic teeth and one had microdontic teeth and teeth with short roots.
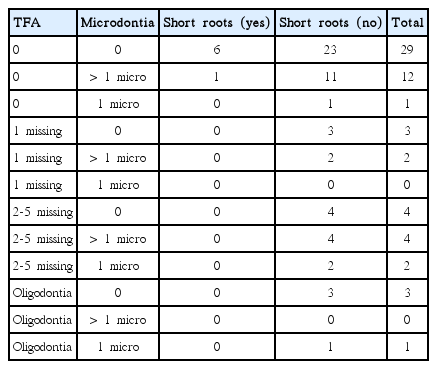
Coexistence of tooth formation anomalies (TFA) in the cancer group

Coexistence of tooth formation anomalies (TFA) in the control group
In the cancer group a significantly higher number of dental anomalies was observed for boys than girls (p=0.04) (Table 7). In contrast, more anomalies were found in girls than in boys in the control group. However, the difference was not statistically significant, as girls had more missing but fewer microdontic teeth.
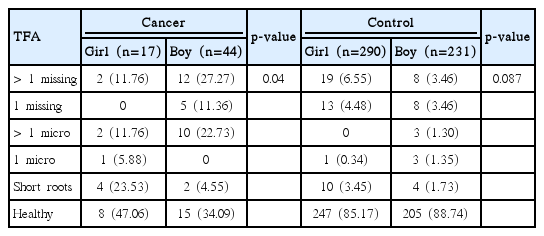
Distribution of tooth formation anomalies (TFA) in both sexes
The variables that might influence the type and rate of dental anomaly in patients were then examined. Although more severe treatment, namely "high dose therapy and bone marrow transplantation," had been introduced in 11 patients, it did not influence the distribution of anomalies. Additional radiation of the head or neck region in an additional eight patients did not increase the rate or severity of dental anomalies (Table 8). Interestingly, of these eight children, five had acute leukaemia and prophylactic central nervous system irradiation with a dose of 12 Gy, while only one had microdontic teeth and one had oligodontia. The three remaining children, one diagnosed with brain tumor and two with rhabdomyosarcoma, were treated with a dose of 40 Gy or higher and all had dental abnormalities, such as oligodontia, short roots, or microdontic teeth.

Correlation of incidence of tooth formation anomaly (TFA) to chemotherapy and radiation
According to the data shown in Table 9, the numbers of dental anomalies in each patient did not differ with age at the beginning, duration, or end of treatment.

Correlation of incidence of tooth formation anomaly with the age at the beginning, end and during the course of therapy
The older the patient the lesser number of missing teeth, but the relationship was not statistically significant (r=–0.086, p=0.507). A similar non-significant relationship (r=–0.103, p=0.428) was found between age at the beginning of therapy and number of microdontic teeth.
A relationship was found between age at the start of treatment and class of microdontic teeth (Fig. 1). Therapy started between 1 and 18 months most often resulted in microdontia of the first premolars. In children aged between 13 and 30 months, it showed correlation with microdontia of second premolars, while it was found in the second molars in children aged between 25 and 36 months. In children whose therapy had started above the age of 61 months, microdontic teeth were found only among the third molars.
Distribution of microdontic teeth in relation to age at the beginning of chemotherapy.
No such relationship was found between terms of beginning of therapy and the prevalence of missing teeth. Agenesis was present in each tooth group irrespective of the age of the child at the start of therapy, although it was most common in second premolars and second molars.
Discussion
Comparable to the results of other studies, the current study confirmed that dental anomalies are much more prevalent in cancer survivors than in healthy children (Figs. 2 and 3).

Girl (cancer patient), aged 9.5 years, microdontic permanent teeth: upper right second molar and second premolar, upper left second premolar and lower left and right second molars.

Boy (cancer patient), aged 8 years, lack of tooth germs: upper left and right first permanent molars.
The most severe anomaly, hypodontia, was three times more common among cancer patients than control subjects (31.14% vs. 9.21%). Such dental anomalies were also found in 16.2% of patients treated for solid tumors and lymphomas and in 31% of patients who underwent stem cell transplantation at the ages of 1.0-9.4 years [13,14]. In a healthy population, hypodontia is found in 2% to 10% of people [15]. In a group of 739 healthy Caucasian 7-year-olds, missing teeth were recorded in 7.4% of children: 8.4% of girls and 6.5% of boys [16]. In the control group, a distribution of abnormality was present in 11.03% of girls and 6.92% of boys, in accordance with data showing that females are more often affected than males at a ratio of 1.5:1 [17]. However, in the cancer group, hypodontia was found three times more often among boys than girls, implying that the disease or the treatment must have modified the occurrence of the anomaly.
In the cancer group, most patients were severely affected, as 1/4 of them had more than one missing tooth. According to Schalk van der Weide [18], severe hypodontia (oligodontia) should be registered when six or more teeth are missing. The prevalence of oligodontia in healthy populations is very low, ranging from 0.08% to 1.1% [18,19]. In light of the above, it can be concluded that the prevalence of oligodontia in both groups was high, with 0.76% in control subjects, and very high, with 6.56%, in the cancer group. The higher prevalence observed in the healthy group can be explained in part by the fact that the children had already been seen and selected by dentists, and almost half of them had sought orthodontic advice. The control patients were also slightly older, as the choice of patients was blinded and all children between the ages of 5 and 18 who had been examined by panoramic radiography in 2013 were included. Patients of the Institute of Dentistry were chosen for the study as there is no national database of radiographs in Poland and no such data could be found in contemporary papers.
The second dental anomaly commonly found in the group was the presence of teeth of smaller than average size. The prevalence of microdontia in cancer survivors was previously estimated to range from 13.5% up to 44% [11,12]; however, in the current study, they were observed in 36.06% of cancer survivors and in 2.87% of control subjects. The prevalence of microdontic teeth in healthy populations has rarely been estimated, being most often limited to peg-shaped lateral incisors, but has been reported to range from 0.8% to 1.7% of the population [11,16]. It was also stressed that patients with agenesis of teeth in general were more likely to present with smaller teeth, particularly in the posterior regions, including premolars and molars [20], which might suggest a correlation between the occurrence of microdontic and missing teeth.
In contrast to the small number of papers concerning the etiology of microdontic teeth, the etiology of hypodontia has been thoroughly investigated. A range of studies conducted on human and mouse models suggest that mutations of specific genes might be responsible for tooth agenesis [17]. Association of several polymorphic mutations of the PAX9 gene with sporadic oligodontia was found in the Polish population [19].
In healthy populations, lateral incisors, second premolars and third molars are more predisposed to agenesis than other teeth [16,21]. The same was found in the current study. However, in cancer patients, second premolars and second molars were most frequently missing whereas lateral incisors and canines were rarely absent. A similar pattern was found in young survivors after stem cell transplantation [11].
Because the prevalence of agenesis was greater in cancer patients, but not in all teeth, the relationship between the terms of tooth calcification and prevalence of abnormalities was examined. In humans, the process of permanent tooth formation begins with the mineralization of the first molars at the time of delivery. The first teeth to emerge after birth are permanent incisors (except lateral ones), which start their formation at the age of 3-4 months. Then the mineralization process develops as follows: canines (4-5 months), maxillary lateral incisors (10-12 months), first premolars (18-24 months), second premolars (24-30 months), second molars (30-36 months), and third molars (between 7 and 10 years) [22]. Unexpectedly, no relationship was found between the distribution of missing teeth and the age of the child at the start of therapy. This lack of connection may confirm the presence of a genetic background to agenesis, or that the teeth buds were completely destroyed by chemotherapy regardless of their stage of development. However, a correlation found between the conditions of calcification and the prevalence of microdontic teeth might suggest that cancer treatment had a direct influence on the development of teeth, resulting in their smaller than normal size. Microdontic teeth were observed in children at age up to 42 months when the therapy was started. Children aged 43 to 61 months were free from the anomaly, and then microdontic third molars were found in children older than 61 months.
In the current study, teeth with short roots were found in seven cancer patients (11.47%) and in 15 control subjects (2.87%). In contemporary studies, the estimated abnormality ranged from 1.3% to 5.6% in healthy populations, and from 0.3% to 1.5% if limited to taurodontic molars [16,23,24]. However, in cancer survivors, the prevalence of various disturbances in root development reported by other authors was much higher, reaching 86.4% or even 100% [13,14]. The discrepancy between the results of the current study and others might be explained in part by difference in the criteria used by different investigators. Also, the young age of our patients at the time of dental investigation might have been critical. Most teeth had not yet finished their development, according to the dental age of the patients, thus estimation of the final consequences was not possible.
Unfortunately, because only eight children underwent irradiation, it is likely that our findings do not indicate any significant relationship between radiation therapy and tooth abnormalities.
In addition, most patients were treated with a low dose of 12 Gy. Three children treated with a high dose (> 40 Gy) had dental malformations, corresponding with the previously published data [3,5,14].
In contrast with the results of other studies, we found no statistically significant relationships between the rate or severity of dental disturbances, and the age of the patient at the beginning, the end, or during anticancer therapy. This may result from the small sample size of our study and it is a significant limitation; however, other literature reports are based on similar numbers of evaluated children [11,13,14]. On the other hand, this discrepancy might be explained by the fact that 51 patients (83.60%) began therapy at an age below 5 years and 46 below 4 years (75.4%). Age 4-5 years is considered critical for tooth development, thus most of our patients were simply in a high risk group.
Conclusion
Our results confirm that anticancer treatment has a significant impact on tooth development, particularly in small children. Hence, as this may affect the quality of life of pediatric patients cured from cancer, this chronic complication should be considered at each follow-up visit.
Notes
Conflict of interest relevant to this article was not reported.