Park, Jung, Park, Kang, Yun, Kim, Kim, Kong, Im, Seo, and The Community of Population-Based Regional Cancer Registries: Cancer Statistics in Korea: Incidence, Mortality, Survival, and Prevalence in 2021
1Korea Central Cancer Registry, National Cancer Center, Goyang, Korea
2Division of Cancer Registration and Surveillance, National Cancer Control Institute, National Cancer Center, Goyang, Korea
3National Cancer Control Institute, National Cancer Center, Goyang, Korea
4National Cancer Center Graduate School of Cancer Science and Policy, National Cancer Center, Goyang, Korea
Correspondence: Kyu-Won Jung, Korea Central Cancer Registry, National Cancer Center, 323 Ilsan-ro, Ilsandong-gu, Goyang 10408, Korea Tel: 82-31-920-2015 Fax: 82-31-920-2179 E-mail: ara@ncc.re.kr
This is an Open Access article distributed under the terms of the Creative Commons Attribution Non-Commercial License (http://creativecommons.org/licenses/by-nc/4.0/) which permits unrestricted non-commercial use, distribution, and reproduction in any medium, provided the original work is properly cited.
Abstract
Purpose
The current study provides national cancer statistics and their secular trends in Korea, including incidence, mortality, survival, and prevalence in 2021.
Materials and Methods
Incidence, survival, and prevalence rates of cancer were calculated using the Korea National Cancer Incidence Database, from 1999 to 2021, with survival follow-up until December 31, 2022. Deaths from cancer were assessed using causes-of-death data obtained from Statistics Korea.
Results
The number of new cancer diagnoses in 2021 increased by 27,002 cases (10.8%) compared to 2020. In 2021, newly diagnosed cancer cases and deaths from cancer were reported as 277,523 (age-standardized rate [ASR], 289.3 per 100,000) and 82,688 (ASR, 67.6 per 100,000), respectively. The overall cancer incidence rates increased by 3.3% annually from 1999 to 2012, and decreased by 5.3% from 2012 to 2015, thereafter, followed by non-significant changes. Cancer mortality rates have been decreasing since 2002, with more rapid decline in recent years (annual decrease of 2.8% from 2002 to 2013; 3.2% from 2013 to 2021). The 5-year relative survival between 2017 and 2021 was 72.1%, which contributed to prevalent cases reaching over 2.4 million in 2021.
Conclusion
In 2021, the number of newly diagnosed cancer patients increased as healthcare utilization recovered from the coronavirus disease 2019–related declines of 2020. Revised cancer registration guidelines expanded the registration scope, particularly for stomach and colorectal cancer. Survival rates have improved over the years, leading to a growing population of cancer survivors, necessitating a comprehensive cancer control strategy. The long-term impact of the pandemic on cancer statistics requires future investigation.
Cancer is one of the leading causes of death worldwide, with an estimated 19.9 million new cancer cases and 9 million deaths worldwide in 2022 [1]. In Korea, cancer has been the leading cause of death since 1983 [2]. In response to this public health threat, the National Plan for Cancer Control was implemented in 1996, and the 4th stage is in effect from 2021. As a fundamental part of the Plan, the Korea Central Cancer Registry (KCCR) publishes cancer registration statistics every year. In contrast to 2020, when the number of cancer cases decreased due to the coronavirus disease 2019 (COVID-19) pandemic, the number of cancer cases increased in 2021 as access to healthcare recovered [3,4]. The impact of reduced healthcare utilization, not only in Korea but worldwide due to COVID-19, on cancer diagnosis and treatment needs to be examined more closely in the coming years [3,5]. In this study, we report the most recent nationwide statistics on cancer incidence, survival, prevalence, and mortality, and their temporal trends.
Materials and Methods
1. Data sources
Annual cancer statistics in Korea are calculated using a national and population-based database of cancer occurrence, the Korea National Cancer Incidence Database (KNCI DB). Every year, the KCCR collects information on patients diagnosed with cancer at hospitals across the country during the past year. The data from the previous year is backed up with information compiled by central and 11 regional cancer registries, including information on cancer patients missed in hospital-based registrations. Hence, it takes two years to complete and calculate the year’s KNCI DB and cancer statistics. The KCCR has reported nationwide statistics since 1999; other detailed information on the KCCR and KNCI DB is provided in our previous report [6]. Completeness is an important indicator of data quality, and the 2021 KNCI DB was estimated to be 98.2% complete using the method proposed by Ajiki et al. [7].
Annual mid-year population data and recently updated mortality data including causes of death from 1983 were obtained from Statistics Korea [2]. To confirm the validity of individual vital statuses used in survival and prevalence calculation, the KNCI DB was linked to both mortality and population resident registration data, which were obtained from the Ministry of the Interior and Safety.
2. Cancer classification
All cancer cases had been registered in accordance with the International Classification of Diseases for Oncology, 3rd edition (ICD-O-3) [8]. The range of cancers to be registered and used for the national statistics calculation was limited to records with a behavior code of “/2 (carcinoma in situ)” or “/3 (malignant),” from the morphology (i.e., histology) codes of ICD-O-3, by which a patient was initially enrolled in the KNCI DB. Since 2021, neuroendocrine tumors (ICD-O-3: 8152 and 8240) of colorectal cancer and gastrointestinal stromal tumors (ICD-O-3: 8936) of stomach cancer have been classified as malignant cancers. Similar to previous reports, malignant cancer cases and their statistics were mainly assessed in this article. In addition, the supplementary incidence statistics for carcinoma in situ cases were also calculated separately, using 2021 KNCI DB.
For the convenience of classification and reporting, the ICD-O-3 codes were converted to the classification of the International Classification of Diseases, 10th edition (ICD-10) [9]. Exceptionally, some hematopoietic diseases (myeloproliferative disorders/myelodysplastic syndromes) are not classified as malignant cancer in ICD-10 classification, therefore their ICD-O-3 codes were used without any conversion. For mortality data, causes of death were coded according to the ICD-10.
We adopted cancer classifications with 24 and 61 types; the former was a modified classification based on the GLOBOCAN cancer dictionary [10], and the latter was the taxonomy used in “Cancer Incidence in Five Continents” [11], and both of them were provided by the International Association of Cancer Registries. In this article, cancer classification with 24 types of cancer was used for description. The summary staging system developed under the Surveillance, Epidemiology, and End Results (SEER) program (i.e., SEER summary staging) [12] was used to categorize the extent of tumor invasion or metastasis.
3. Statistical analyses
Incidence, mortality, and prevalence rates were expressed as crude rates (CRs) or age-standardized rates (ASRs) per 100,000 people. The CR was defined as the total number of newly diagnosed (for incidence) or deceased (for mortality) cases in a year divided by the mid-year population. The ASR was defined as the weighted average of the age-specific rates in which the weights represent the proportions of people in the corresponding age groups in a standard population [13]. ASRs were standardized using Segi’s world standard population [14]. The cumulative risk of developing cancer from birth to life expectancy during 2021 in Korea were also assessed, assuming no other cause of death (i.e., by simply calculating the sum of the age-specific cancer rates from birth to life expectancy), as follows [13]:
Trends in ASRs were estimated using Joinpoint regression, with a maximum number of two joinpoints. The results were summarized as annual percentage changes with the best model fit, based on a linear model for the natural log-transformed ASRs.
The survival rate of cancer patients, diagnosed between 1993 and 2021, was calculated based on the results of follow-up until December 31, 2022. The 5-year relative survival rate was defined as the ratio of observed survival of cancer patients to expected survival in the general population, adjusting the effects of other causes of death using the standard population life table provided by Statistics Korea [2]. Relative survival rates were estimated using the Ederer II method [15] with some minor corrections, based on an algorithm devised by Paul Dickman [16]. Trends in 5-year relative survival rates were evaluated as percent differences in survival rates between 1993-1995 and 2017-2021.
Prevalent cases were defined as the number of cancer patients alive on January 1, 2022, among all the patients diagnosed with cancer between 1999 and 2021. p < 0.05 was considered statistically significant. Joinpoint 5.0.2.0 (National Cancer Institute, Bethesda, MD) and SAS ver. 9.4 (SAS Institute Inc., Cary, NC) were used for statistical analyses.
Results
1. Incidence
The number of new cancer diagnoses in 2021 increased by 27,002 cases (10.8%) compared to 2020. In 2021, a total of 277,523 people were newly diagnosed with cancer in Korea, of which 51.8% (143,723 cases) were men and 48.2% (133,800 cases) were women (Table 1). The five most diagnosed cancers in Korea were thyroid, colorectal, lung, stomach, and breast cancers; in men, lung and stomach cancers were followed by colorectal, prostate, and liver cancers, whereas breast and thyroid cancers were followed by colorectal, lung, and stomach cancers in women. These top five cancers in each sex accounted for 62.4% and 66.6% of all cancer cases in men and women, respectively. Among the five most diagnosed cancers, the increase in new cancer diagnoses in 2021 compared to 2020 was the largest for thyroid cancer (5,667 cases, 19.1%), followed by colorectal cancer (4,471 cases, 15.8%), and lung cancer (2,397 cases, 8.2%). Thyroid cancer was the most frequent cancer from 2010 to 2014: its ranking fell after the debate on overdiagnosis in 2014, but recently rose again and regained the first rank since 2019. Table 2 provides the CRs and ASRs of cancer incidence in 2021. The CR and ASR of all cancer incidence were 540.6 per 100,000 (561.7 for men and 519.7 for women) and 289.3 per 100,000 (298.2 for men and 292.5 for women), respectively. The difference between CR and ASR implies that the majority of cancer patients in Korea belong to the elderly, as opposed to the world’s standard population, which has a higher proportion of young people. The overall lifetime probability of being diagnosed with any cancer was 38.1%, under the condition that one survives to the age that matches the life expectancy of the Korean population. That probability was higher in men (39.1%) than in women (36.0%) (data not shown).
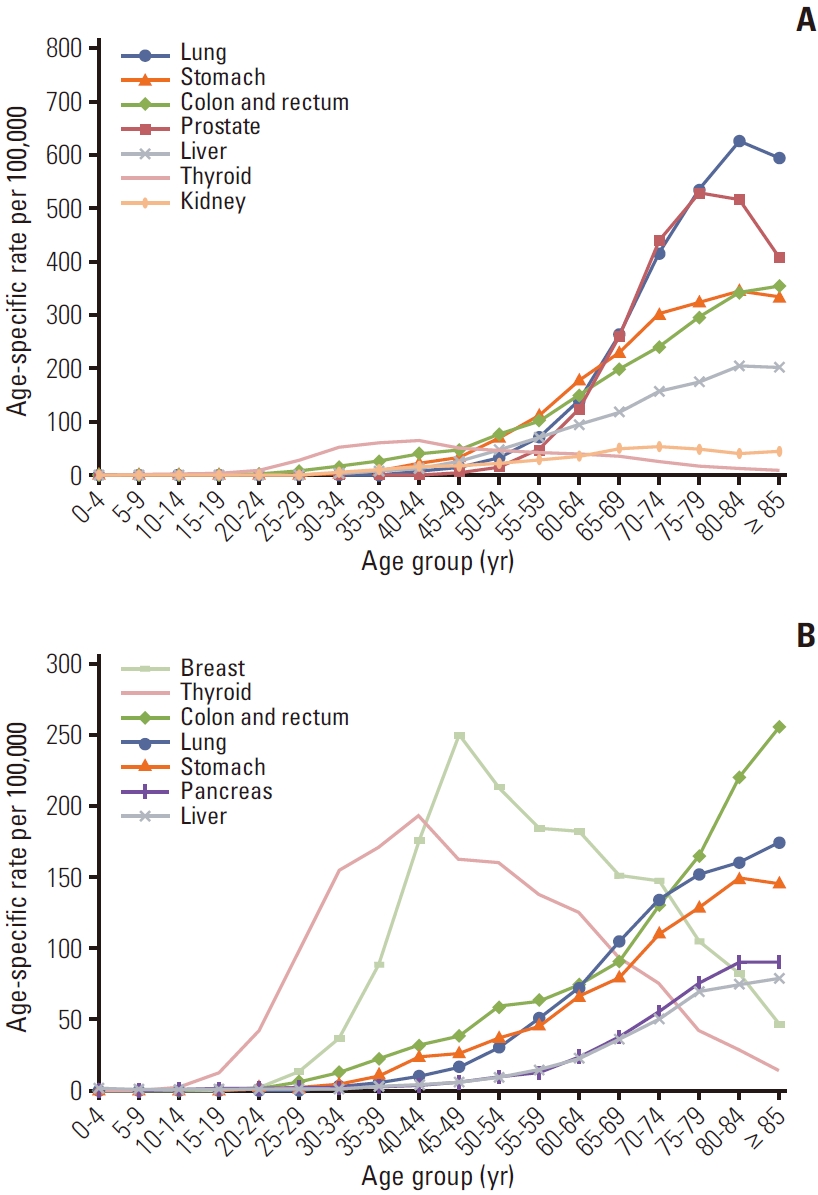
There were marked differences in age-specific incidence rates (Fig. 1). In the childhood population (0-14 years), leukemia, brain and central nervous system (CNS) cancer, and non-Hodgkin lymphoma were the top three cancers in both sexes, accounting for 32.2%, 14.8%, and 11.3% of all cancer cases diagnosed in this age group, respectively. Thyroid cancer was the most common cancer in both sexes among the adolescent and young adult populations (15-34 years), accounting for 54.7% of all cancers diagnosed. The most common cancers in that age group, excluding thyroid cancer, were colorectal cancer and leukemia in men, and breast and colorectal cancer in women. In the 35-64-year age group, men were most commonly diagnosed with colorectal, stomach, thyroid, and lung cancers (collectively accounting for 52.0%), while breast and thyroid cancers were the most common in women (collectively accounting for 56.0%). For those aged 65 years and above, lung and prostate cancers were the most common in men, while colorectal and lung cancers were the most common in women. Most cancers have shown to increase in incidence with age; the exceptions were thyroid cancer in both sexes and breast cancer in women, which showed the highest incidence in those in their 30-40s and 40-50s age groups, respectively (Fig. 2).
2. Mortality
Since the causes-of-death statistics were published in 1983, cancer has been the number one cause of death in Korea. As of 2021, a total of 82,688 people (61.6% men and 38.4% women) died of cancer, accounting for 26.0% of all deaths in Korea (Tables 1 and 3). The overall CR for cancer deaths was 161.1 per 100,000, and the rate was approximately 1.6 times higher for men than for women (Table 4). Lung cancer was the leading cause of cancer death in both sexes (CR, 54.5 per 100,000 in men and 19.2 per 100,000 in women), followed by liver and colorectal cancers in men, and colorectal and pancreatic cancers in women. When stratified according to the age at the time of death, the most common causes of cancer mortality in both sexes were as follows: leukemia in their 10s and 20s, breast cancer in their 30s, liver cancer in their 40s and 50s, and lung cancer among those 60 years old or older (data not shown).
3. Trends in cancer incidence and mortality
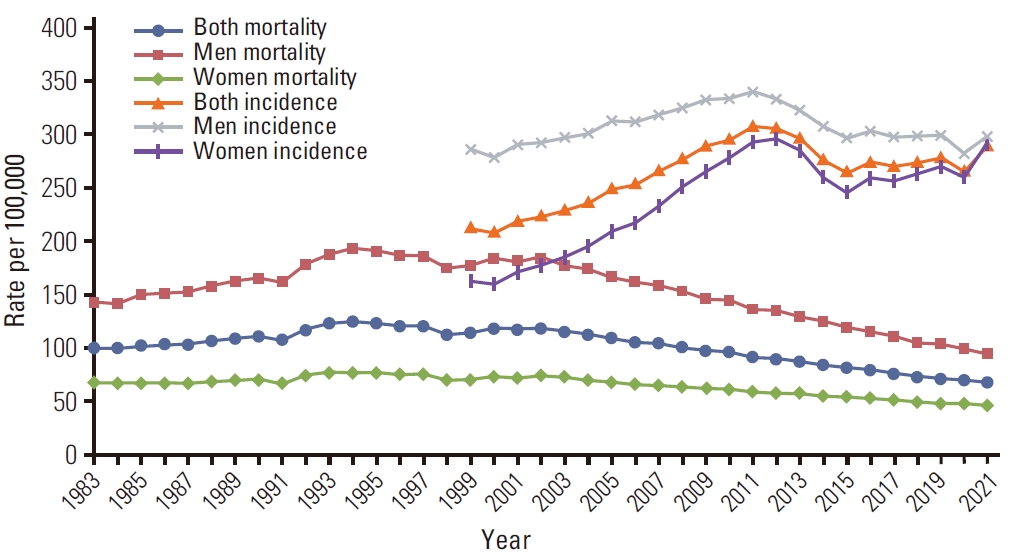
Changes in cancer incidence rates from 1999 to 2021 and mortality rates from 1983 to 2021 are depicted in Fig. 3. Compared to 1999, cancer incidence rates increased about 36.4% and mortality rates decreased about 41.3%, in 2021 (Table 5). The overall cancer incidence rates increased by approximately 3.3% per year until 2012, followed by a decline until 2015 with an annual decrease of 5.3%, and thereafter showed nonsignificant changes. In contrast, cancer mortality rates demonstrated nonsignificant changes until 2002, and decreased thereafter with an annual decrease of 2.8% until 2013, and a further decrease of 3.2% per year until 2021. These trends were observed similarly in both men and women, although the slopes of change were much more pronounced in women for incidence, and in men for mortality rates (S1 and S2 Tables).
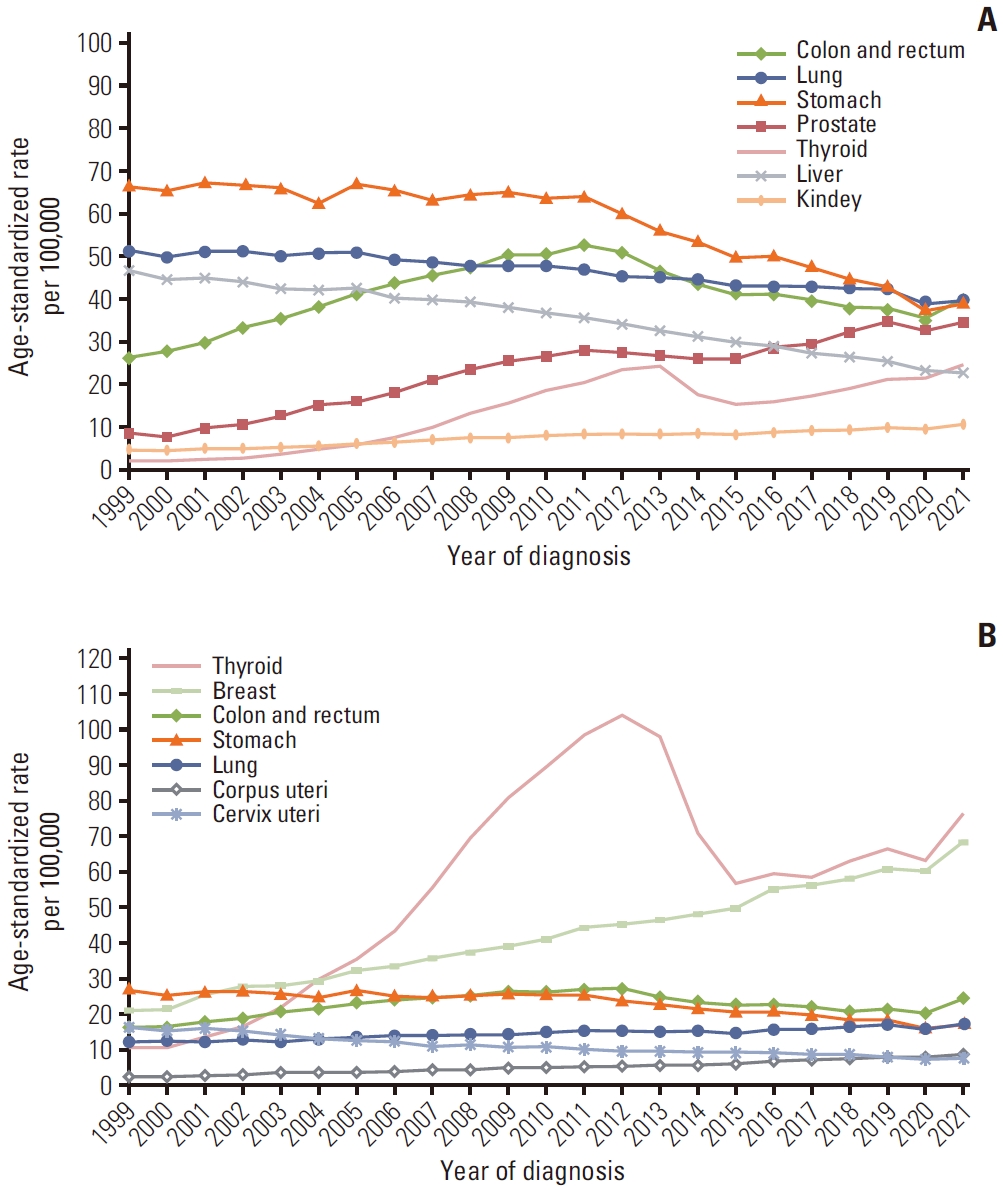
Since 1999, breast, pancreas, kidney, and hematologic (leukemia and lymphoma) cancers, and that of some male or female reproductive organs (ovary, corpus uteri, prostate, and testis) have been continuously increasing. In both sexes combined, breast (especially for women) and kidney cancers displayed initial rapid increases and then lessened increases after 2007 and 2008, respectively. Prostate cancer demonstrated distinguished increase until 2009, followed by nonsignificant trend until 2015, and regained increasing trend thereafter. The remaining cancers with increasing trend revealed steady increases throughout the entire period. On the other hand, the incidences of colorectal and bladder cancers demonstrated increasing trends that have recently reversed significantly, with decreases starting in 2010 and 2004, respectively. In contrast, stomach and liver cancers demonstrated initial moderate decreasing trends until 2011 and 2010, respectively, followed by more rapid decreases thereafter; and cervical cancer showed marked decrease until 2007, however it showed lessened decrease thereafter until now. Lastly, the incidence of thyroid cancer increased significantly between 1999 and 2011, decreased significantly between 2011 and 2016, and increased again from 2016 (Table 5). These trends were observed similarly in both men and women, except for breast cancer in men and bladder cancer in women that revealed partially different results of trends from those described above. In men, decreasing trend of stomach, lung, and liver cancer throughout the period and colorectal cancer since 2010 were significant while prostate and kidney cancer had an increasing trend. In women, stomach, colorectal, liver, and cervix cancer had decreasing trend while breast and lung cancer revealed an increasing trend. The characteristic trend of thyroid cancer which changed rapidly in a short period of time, was more pronounced in women than in men (Fig. 4, S1 and S2 Tables).
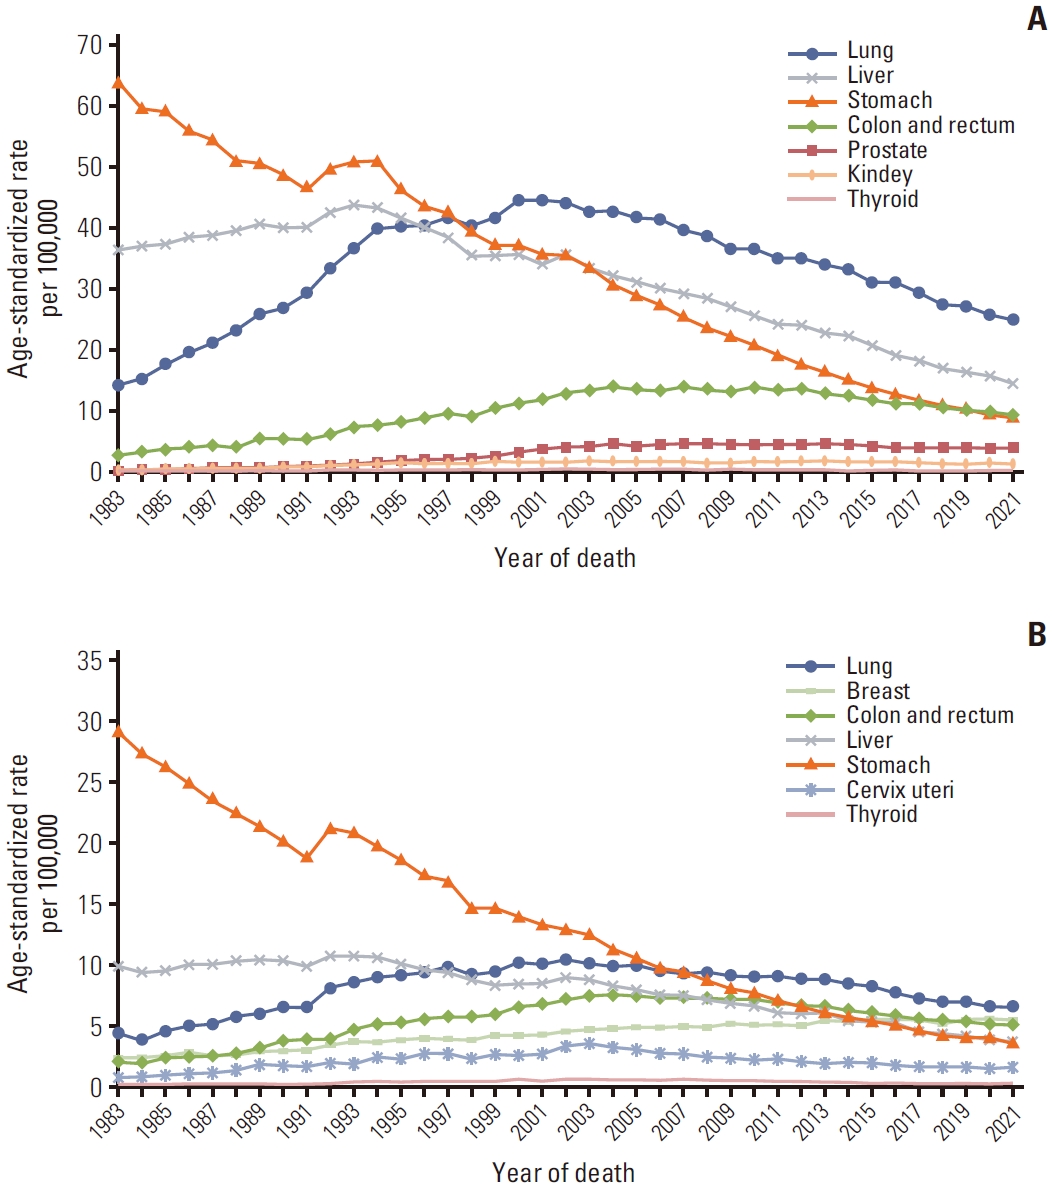
The ASRs for mortality in most cancers have shown decreasing trends in Korea. Stomach cancer revealed continuous decreasing trends throughout the entire observed period for mortality, with more pronounced decreasing slopes in more recent periods. Liver and lung cancer mortality rates began to decrease in 2002 and 2001, respectively, followed by further rapid decreases starting in 2014 and 2013, respectively. On the other hand, the mortality rates of colorectal, cervical, and thyroid cancers initially increased significantly until 2003; since then, the mortality rate from these cancers significantly decreased (Table 5). These trends were observed similarly in both sexes. However, breast cancer in women displayed significantly increasing mortality trends throughout the entire observed period, with less increasing trend after 2005 (Fig. 5, S1 and S2 Tables).
4. Survival rates
Over the past two decades, when cancer survival statistics have been compiled, the relative survival rates of cancer patients have increased significantly and steadily. The 5-year relative survival rates for all patients diagnosed with cancer in the recent five years, from 2017 to 2021 were 72.1% in both sexes; 66.1% in men and 78.2% in women (Table 6). The temporal increasing trends in survival rates, from 42.9% in 1993-1995 to 72.1% in 2017-2021, were maintained even after excluding thyroid cancer (from 41.2% in 1993-1995 to 67.8% in 2017-2021), which has an excellent prognosis with a 5-year relative survival rate of 100%.
After thyroid cancer, survival rates were the highest for prostate and testis cancers in men (96.0% and 95.6%, respectively) and breast cancer in women (93.8%). On the contrary, the survival rates were the lowest for cancers of the pancreas (15.9%), and gallbladder plus other and unspecified parts of the biliary tract (28.9%) in both sexes. Prostate cancer (men), lung cancer (women), stomach cancer (both sexes), and lip, oral cavity, and pharynx (men) were associated with outstanding improvements in survival rates over the observed period. In contrast, brain and CNS cancer showed a decline in both sexes.
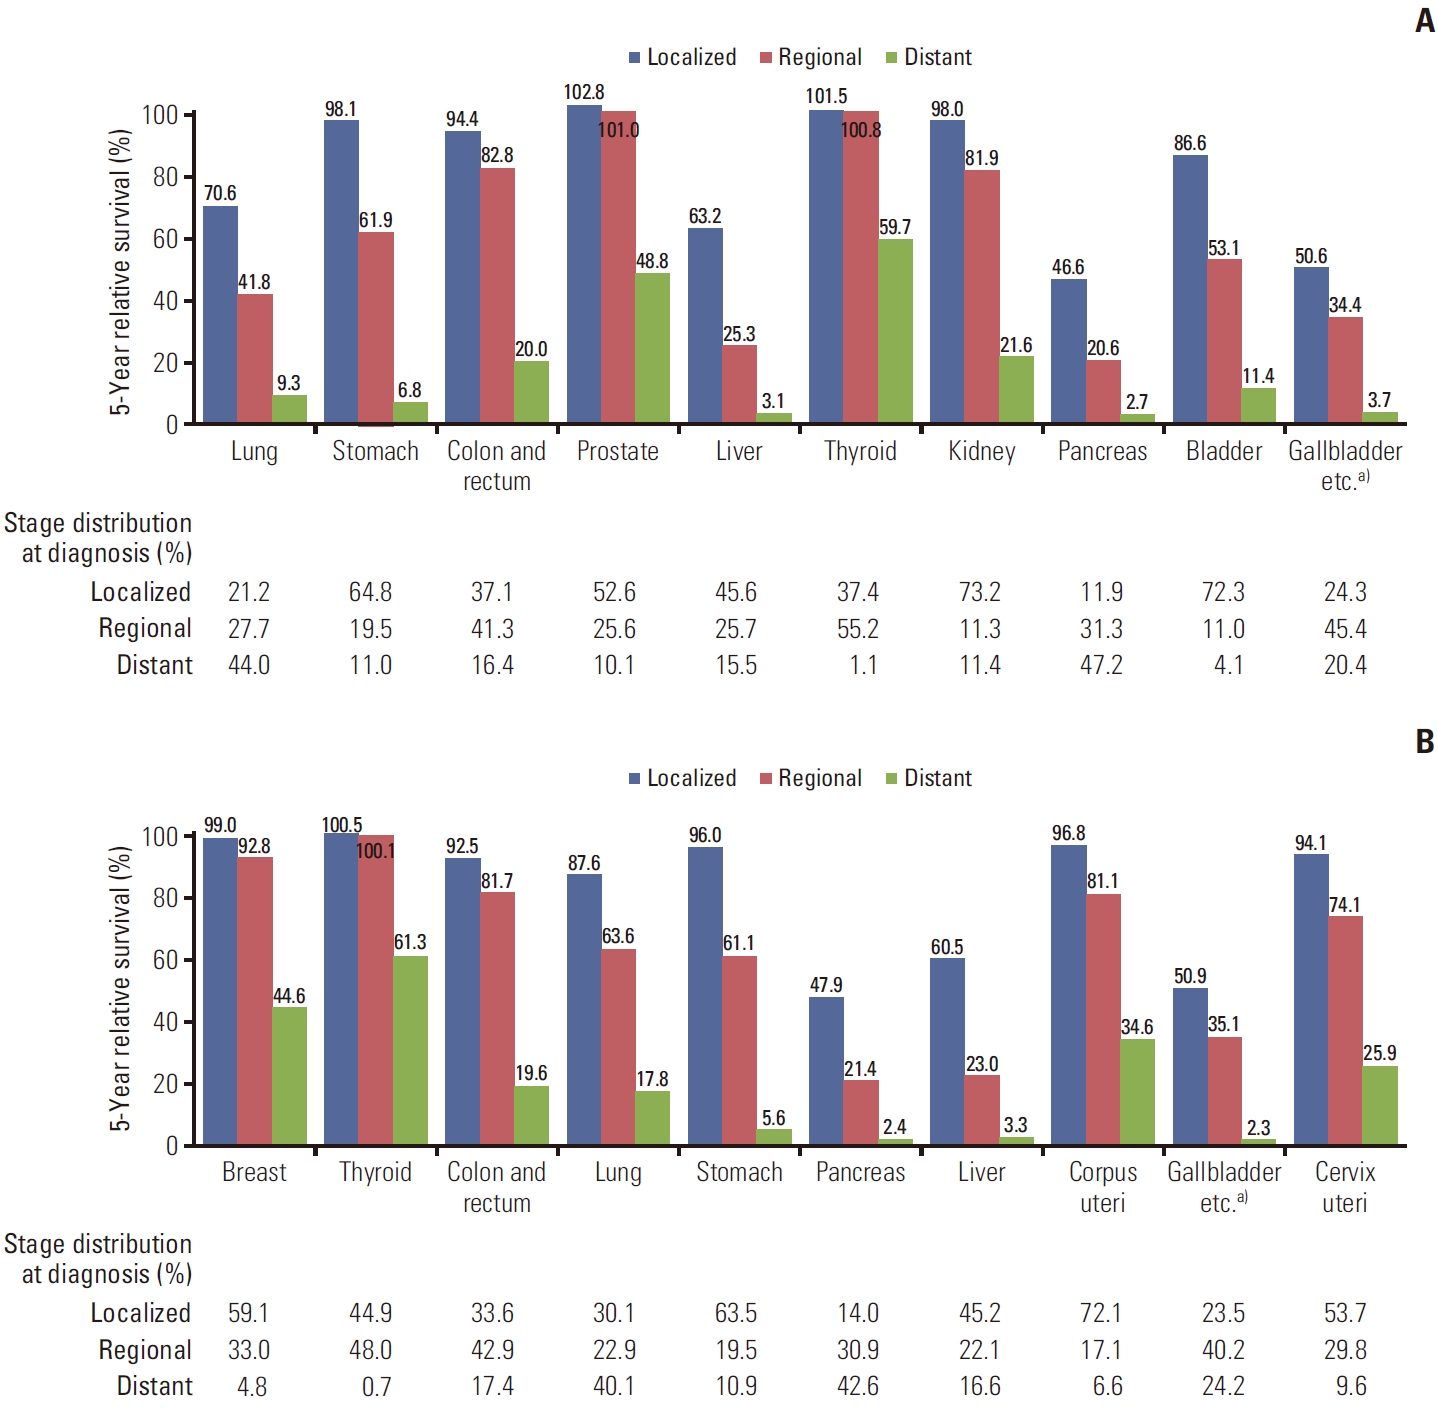
In terms of stage distribution at diagnosis and recent survival rates according to the SEER summary stage in each cancer, Fig. 6 shows the top 10 most common cancers for each sex in 2021. In men, kidney, bladder and stomach cancers revealed the highest proportions of patients who were diagnosed at the localized stage (73.2%, 72.3%, and 64.8%, respectively), accompanied by the 5-year survival rates of 98.0%, 86.6%, and 98.1%, respectively. In contrast, pancreatic and lung cancers demonstrated the highest proportions of patients diagnosed at the distant metastatic stage, which approximated to 50%, with corresponding 5-year survival rates of 2.7% and 9.3%, respectively. In women, 72.1%, 63.5%, and 59.1% of uterine corpus, stomach, and breast cancers, respectively, were diagnosed at the localized stage, with 5-year survival rates of 96.8%, 96.0%, and 99.0%, respectively. However, more than 40% of pancreatic and lung cancers were diagnosed at the distant metastatic stage, with 5-year survival rates of 2.4% and 17.8%, respectively.
5. Prevalence rates
The total prevalent cancer cases in 2021 (identified as survivor at the time of January 1, 2022) were 2,434,089, surpassing 2 million since 2018 (Table 1). It suggested that one in 21 people (4.7% of the entire Korean population; 4.2% of men and 5.3% of women) has a history of being diagnosed with cancer. Of these, 1,194,156 (49.1% of all prevalent cases) were aged ≥ 65 years, indicating that one in seven people in that age group (17.2% of, or one in six, men and 11.4% of, or one in nine, women) would have experienced cancer (data not shown).
Table 7 provides the CRs and ASRs of prevalence for all cancers combined and for specific cancers. In total, the cancer prevalence rate for 2021 in Korea was 4,741.7 per 100,000 people. Thyroid cancer had the highest prevalence (CR, 1,019.6 per 100,000; 390.3 per 100,000 for men and 1,645.2 per 100,000 for women), followed by stomach cancer (CR, 669.9 per 100,000) and colorectal cancer (CR, 603.4 per 100,000). Prostate cancer in men and breast cancer in women revealed the highest prevalence rates (CR, 520.4 and 1,180.1 per 100,000, respectively).
The number of prevalent cases for common cancers, according to the time since cancer diagnosis, are described in Fig. 7. In total, 1,479,536 (60.8% of all prevalent cases) had survived > 5 years after cancer diagnosis, majority of them being survivors of thyroid, stomach, colorectal, and breast cancers. Another 510,053 (21.0% of all prevalent cases) have been alive 2-5 years after their cancer diagnosis, in which period they need regular follow-up; and the rest were 444,500 (18.3% of all prevalent cases) for whom it had been < 2 years since their cancer diagnosis, in which period they still need active cancer treatment.
6. Carcinoma in situ incidence
A summary of carcinoma in situ cases in 2021 is provided as a Supplementary Material (S3-S6 Tables, S7-S9 Figs.).
Conclusion
Compared to 2020, the number of new cancer diagnoses in 2021 increased as healthcare utilization, including cancer screening test, recovered from the declines caused by COVID-19 in 2020. Additionally, revised cancer registration guidelines have expanded the scope of cancer registration, particularly for stomach and colorectal cancer. Since 2015, the number of new cancer patients in Korea has been increasing except for 2020. However, the ASRs of incidence did not show a significant change. During the past decade, the incidence of stomach, liver, and cervical cancer has been declining while that of prostate and breast cancer have been on the rise since 1999. Thyroid cancer, which has decreased since 2012, has shown an increasing trend since 2015. The 5-year relative survival rate of cancer patients diagnosed in the past 5 years was 72.1%, which is steadily improving. Since 2018, the number of cancer survivors has exceeded 2 million, of which 60.8% are those who survived over 5 years. As the number of newly diagnosed cancer patients, cancer survival rates, and cancer prevalence continue to increase, national cancer control strategies must be planned and implemented to keep pace with these changing cancer statistics. In addition, the impact of the COVID-19 pandemic on cancer diagnosis and treatment should be evaluated in further studies.
*Regional Cancer Registry Committee
Chang-Hoon Kim (Busan Cancer Registry, Pusan National University Hospital), Cheolin Yoo (Ulsan Cancer Registry, Ulsan University Hospital), Yong-Dae Kim (Chungbuk Cancer Registry, Chungbuk National University Hospital), Young-Taek Kim (Daejeon/Chungnam Cancer Registry, Chungnam National University and Hospital), Chul-Min Park (Jeju Cancer Registry, Jeju National University Hospital), Jung-Ho Youm (Chungbuk Cancer Registry, Chungbuk National University Hospital), Kyu-Hyoung Lim (Kangwon Cancer Registry, Kangwon National University Hospital), Nam-Soo Hong (Daegu/Gyeongbuk Cancer Registry, Kyungpook National University Hospital), Sun-Seog Kweon (Gwangju/Jeonnam Cancer Registry, Chonnam National University Hwasun Hospital), Hwan-Cheol Kim (Incheon Cancer Registry, Inha University Hospital), Ki-Soo Park (Gyeongnam Cancer Registry, Gyeongsang National University Hospital).
Electronic Supplementary Material
Supplementary materials are available at Cancer Research and Treatment website (https://www.e-crt.org).
Collected the data: Jung KW, Regional Cancer Registry Committee.
Contributed data or analysis tools: Park EH, Jung KW, Kong HJ, Kang MJ, Yun EH.
Performed the analysis: Park NJ.
Wrote the paper: Park EH, Jung KW.
Interpretation and review: Jung KW, Kang MJ.
Review and comment: Kim HJ, Kim JE, Im JS, Seo HG.
Conflicts of Interest
Conflict of interest relevant to this article was not reported.
Acknowledgments
Special thanks to the tumor registrars (health information managers) of the Korea Central Cancer Registry (KCCR)-affiliated and non-KCCR-affiliated hospitals for data collection, abstracting, and coding. Additionally, we acknowledge the cooperation of the National Health Insurance Service and Statistics Korea for data support. This work was supported by the Health Promotion Fund of the Ministry of Health & Welfare (No. 2360020) and a research grant (No. 2211110) from the National Cancer Center, Republic of Korea.
Fig. 1.
The five common sites of cancer incidence by age group and sex in Korea, 2021. (A) Men. (B) Women. Numbers in the graph are age-specific incidence rates per 100,000. CNS, central nervous system.
Fig. 2.
Age-specific incidence rates of common cancers for 2021 in Korea. (A) Men. (B) Women.
Fig. 3.
Annual age-standardized cancer incidence and mortality rates by sex for all sites from 1983 to 2021 in Korea. Age standardization was based on Segi’s world standard population.
Fig. 4.
Trends in age-standardized incidences of selected cancers by sex from 1999 to 2021 in Korea. (A) Men. (B) Women. Age standardization was based on Segi’s world standard population.
Fig. 5.
Trends in age-standardized mortalities of selected cancers by sex from 1983 to 2021 in Korea. (A) Men. (B) Women. Age standardization was based on Segi’s world standard population.
Fig. 6.
Five-year relative survival rates by stage at diagnosis and stage distribution of selected cancers by sex in Korea, 2017-2021. (A) Men. (B) Women. Staging according to the Surveillance, Epidemiology, and End Results (SEER) stage categories. For each cancer type, stage categories do not total 100% because sufficient information was not available to stage all cases. a)Includes the gallbladder and other/unspecified parts of the biliary tract.
Fig. 7.
Prevalent cases of common cancers by time since cancer diagnosis. Prevalent cases were defined as the number of cancer patients alive on January 1, 2022 among all cancer patients diagnosed between 1999 and 2021.
Table 1.
Cancer incidence, deaths and prevalence by sex in Korea, 2021
a) Limited-duration prevalent cases on January 1, 2021. These are patients who were diagnosed between January 1, 1999 and December 31, 2021 and who were alive on January 1, 2022. Multiple primary cancer cases were counted multiple times,
b) Includes the gallbladder and other/unspecified parts of the biliary tract.
Table 2.
Crude and age-standardized cancer incidence rates by sex in Korea, 2021
APC was calculated using age-standardized incidence data based on the Segi’s world standard population. APC, annual percentage change; CNS, central nervous system.
a) Significantly different from zero (p < 0.05),
b) Includes the gallbladder and other/unspecified parts of the biliary tract.
Table 6.
Trends in the 5-year relative survival rates (%) by sex and year of diagnosis from 1993 to 2021 in Korea
a) Crude prevalence rate: number of prevalent cases divided by the corresponding person-years of observation. Prevalent cases were defined as patients who were diagnosed between January 1, 1999 and December 31, 2021 and who were alive on January 1, 2022. Multiple primary cancer cases were counted multiple times,
b) Age-adjusted using the Segi’s world standard population,
c) Includes the gallbladder and other/unspecified parts of the biliary tract.
References
1. Ferlay J, Ervik M, Lam F, Laversanne M, Colombet M, Mery L, et al. Global Cancer Observatory: Cancer Today [Internet]. Lyon: International Agency for Research on Cancer; 2022 [cited 2024 Feb 14]. Available from: https://gco.iarc.who.int/today/
2. Statistics Korea [Internet]. Daejeon: Statistics Korea; 2022 [cited 2024 Feb 14]. Available from: https://kosis.kr
3. Yoo KJ, Lee Y, Lee S, Friebel R, Shin SA, Lee T, et al. The road to recovery: impact of COVID-19 on healthcare utilization in South Korea in 2016-2022 using an interrupted time-series analysis. Lancet Reg Health West Pac. 2023;41:100904.
4. Lee K, Lee YY, Suh M, Jun JK, Park B, Kim Y, et al. Impact of COVID-19 on cancer screening in South Korea. Sci Rep. 2022;12:11380.
5. Siegel RL, Miller KD, Wagle NS, Jemal A. Cancer statistics, 2023. CA Cancer J Clin. 2023;73:17–48.
6. Shin HR, Won YJ, Jung KW, Kong HJ, Yim SH, Lee JK, et al. Nationwide cancer incidence in Korea, 1999~2001: first result using the National Cancer Incidence Database. Cancer Res Treat. 2005;37:325–31.
7. Ajiki W, Tsukuma H, Oshima A. Index for evaluating completeness of registration in population-based cancer registries and estimation of registration rate at the Osaka Cancer Registry between 1966 and 1992 using this index. Nihon Koshu Eisei Zasshi. 1998;45:1011–7.
8. World Health Organization. International Classification of Diseases for Oncology (ICD-O), 3rd ed. 2nd rev. [Internet]. Geneva: World Health Organization; 2019 [cited 2024 Feb 14]. Available from: https://iris.who.int/handle/10665/96612
9. World Health Organization. International statistical classification of diseases and related health problems, 10th rev. [Internet]. Geneva: World Health Organization; 2009 [cited 2024 Feb 14]. Available from: https://iris.who.int/handle/10665/44081
10. Ferlay J, Ervik M, Lam F, Colombet M, Mery L, Pineros M, et al. Global Cancer Observatory: Cancer Today – data and methods [Internet]. Lyon: International Agency for Research on Cancer; 2020 [cited 2024 Feb 14]. Available from: https://gco.iarc.who.int/today/data-sources-methods
11. Bray F, Colombet M, Aitken JF, Bardot A, Eser S, Galceran J, et al. Cancer incidence in five continents, Vol. XII (IARC CancerBase No. 19). Chapter 3. Classification and coding [Internet]. Lyon: International Agency for Research on Cancer; 2023 [cited 2024 Feb 14]. Available from: https://ci5.iarc.fr/ci5-xii/chapters
12. Young JL Jr, Roffers SD, Ries LA, Fritz AG, Hurlbut AA. SEER summary staging manual 2000: codes and coding instructions. NIH Pub. No. 01-4969. Bethesda, MD: National Cancer Institute; 2001.
13. Bray F, Colombet M, Aitken JF, Bardot A, Eser S, Galceran J, et al. Cancer incidence in five continents, Vol. XII (IARC CancerBase No. 19). Chapter 7. Age standardization [Internet]. Lyon: International Agency for Research on Cancer; 2023 [cited 2024 Feb 14]. Available from: https://ci5.iarc.fr/ci5-xii/chapters
14. Segi M. Cancer mortality for selected sites in 24 countries (1950-1957). Sendai: Department of Public Health, Tohoku University School of Medicine; 1960.
15. Ederer F, Heise H. Instructions to IBM 650 programmers inprocessing survival computations. Methodological note, No.10. Bethesda, MD: National Cancer Institute; 1959.
16. Paul Dickman [Internet]. Stockholm: PaulDickman.com; 2016[cited 2024 Feb 14]. Available from: https://www.pauldickman.com/