Introduction
Gastric cancer (GC) is the third most common cause of cancer-related deaths worldwide [1]. The incidence rate of GC increases with age, and more than half of the new cases occur in the elderly aged ≥ 65 years [2,3]. For patients with metastatic or recurrent GC (MRGC), fluoropyrimidine plus platinum combination is the most widely accepted first-line chemotherapy regimen based on phase 3 clinical trials [4–11]. However, most patients enrolled in those trials were younger patients with a median age of 54–64 years.
Elderly patients often present with multiple comorbidities and age-related impaired organ function, which can lead to increased toxicity. In real-world clinical practice, elderly patients are less likely to be offered chemotherapy and tend to receive less intensive treatment [12]. Clinical trials specific to elderly patients are required to guide optimal treatment in this age group. However, only few trials have been designed and conducted specifically for elderly patients with MRGC. In a randomized phase 2 trial of capecitabine vs. S-1 in chemo-naïve patients aged ≥ 65 years with MRGC, both capecitabine and S-1 were found to be active and tolerable [13]. In a small phase 3 trial of 50 patients aged ≥ 70 years with MRGC, capecitabine plus oxaliplatin combination chemotherapy showed a trend of increased survival benefit compared with capecitabine monotherapy as first-line chemotherapy [14]. Currently, there remains uncertainty regarding the optimal chemotherapeutic regimens for these patients. We conducted this randomized phase 3 trial on elderly patients with MRGC to compare efficacy and safety between combination therapy and monotherapy.
Materials and Methods
1. Study design
This open-label, phase 3 trial was conducted at 14 Korean institutions. After obtaining written informed consent, patients were randomly allocated (1:1) to receive either combination therapy (group A) or monotherapy (group B) using computer-generated permutated-block randomization. Three stratification factors were used: age (< 75 vs. ≥ 75 years), Eastern Cooperative Oncology Group (ECOG) performance status (PS) (0–1 vs. 2), and fluoropyrimidine backbones (5-fluorouracil [5-FU] vs. capecitabine vs. S-1).
This study was conducted in compliance with Good Clinical Practice guidelines and the Declaration of Helsinki. The study was approved by the institutional review board at each institution and registered with ClinicalTrials.gov (NCT02114359).
2. Patient eligibility criteria
Patients (≥ 70 years) with histologically confirmed metastatic or recurrent adenocarcinoma of the stomach or gastroesophageal junction were eligible if they met the following inclusion criteria: no previous chemotherapy except adjuvant chemotherapy completed at least 6 months before enrollment; ECOG PS 0–2; the existence of at least one lesion that is measurable, or is non-measurable but evaluable, according to the Response Evaluation Criteria in Solid Tumors (RECIST ver. 1.1); life expectancy ≥ 3 months; sufficient bone marrow, hepatic and renal function. The exclusion criteria were as follows: human epidermal growth factor receptor-2 (HER-2)–positive disease; recent radiotherapy within 2 weeks; recent major surgery within 4 weeks; uncontrolled central nervous system metastasis, or other serious comorbidities.
3. Study treatment
The group A consisted of four regimens: (1) 5-FU/leucovorin/oxaliplatin (FOLFOX); (2) capecitabine/oxaliplatin (CAPOX); (3) S-1/cisplatin; (4) capecitabine/cisplatin. The fluoropyrimidine backbone was selected by the attending investigator before randomization. In each regimen, starting dose of chemotherapeutic agents was about 80% of standard dose. After the first cycle of chemotherapy, it could be escalated to 100% (Table 1); this was at the discretion of the investigator if hematological or non-hematological toxicity of ≥ grade 2 did not occur based on the National Cancer Institute Common Terminology Criteria for Adverse Events (NCI CTCAE ver. 4.03).
The group B consisted of three regimens of fluoropyrimidine only: (1) 5-FU/leucovorin (FL); (2) oral capecitabine; (3) oral S-1. In this monotherapy group, treatment was started with the standard dose (100%).
The dosage and administration of each regimen is detailed in Table 1. Chemotherapy was continued until the occurrence of tumor progression, intolerable adverse events (AEs), or withdrawal of patient’s consent. Dose reductions and/or interruptions during chemotherapy were conducted in response to chemotherapy-related AEs.
4. Assessments
Pretreatment assessment included medical history, physical examination, blood tests, electrocardiogram, chest radiography, and computed tomography (CT) of the abdomen and pelvis (chest CT was also performed if indicated). Tumor response was assessed using CT according to the RECIST, with the first four evaluations performed every 6 weeks and subsequent evaluation every 8 weeks until progressive disease (PD). AEs were graded according to the NCI CTCAE. Quality of life (QOL) was assessed using questionnaires (European Organization for Research and Treatment of Cancer [EORTC] Quality of Life Questionnaires [QLQ]-C30 and QLQ-STO22) [15,16]. These QOL measurements were conducted before the initiation of chemotherapy and thereafter every 6 weeks for the first two measurements, followed by subsequent measurements every 12 weeks, and at the end of the study treatment.
5. Statistical considerations
The primary endpoint of this study was overall survival (OS), defined as the time from randomization to the date of death from any cause. The secondary endpoints included progression-free survival (PFS), overall response rate (ORR), safety, and changes in QOL. PFS was defined as the time from randomization to the date of PD or death from any cause. ORR was defined as the proportion of patients with complete response or partial response among patients with ≥ 1 measurable lesion. The OS and PFS were estimated using the Kaplan-Meier method and between-group difference was assessed using a log-rank test. Cox proportional hazards regression model was used to calculate hazard ratios (HRs).
Regarding sample size calculation, we assumed a median OS of 10 months with combination therapy vs. 7 months with monotherapy. With the following initial assumptions, 247 events were required to achieve at least 80% power, for which 298 patients were necessary: (1) two-sided type I error rate (α)=0.05; (2) follow-up period=12 months; and (3) enrollment period=24 months. Considering a dropout rate of 10%, total of 332 patients was initially set. However, patient enrollment was delayed more than expected, and as the expected enrollment period was extended to 60 months with one-sided α=0.05, the final sample size was changed to 238 patients (119 in each group considering a 10% dropout rate).
Efficacy analyses were primarily conducted on the subjects included in the full-analysis set (FAS) and also on the subjects in the per-protocol set (PPS). The safety set included all subjects who received at least one study treatment after randomization. Statistical analyses were done using SAS ver. 9.4 (SAS Institute Inc., Cary, NC).
Results
1. Patient characteristics
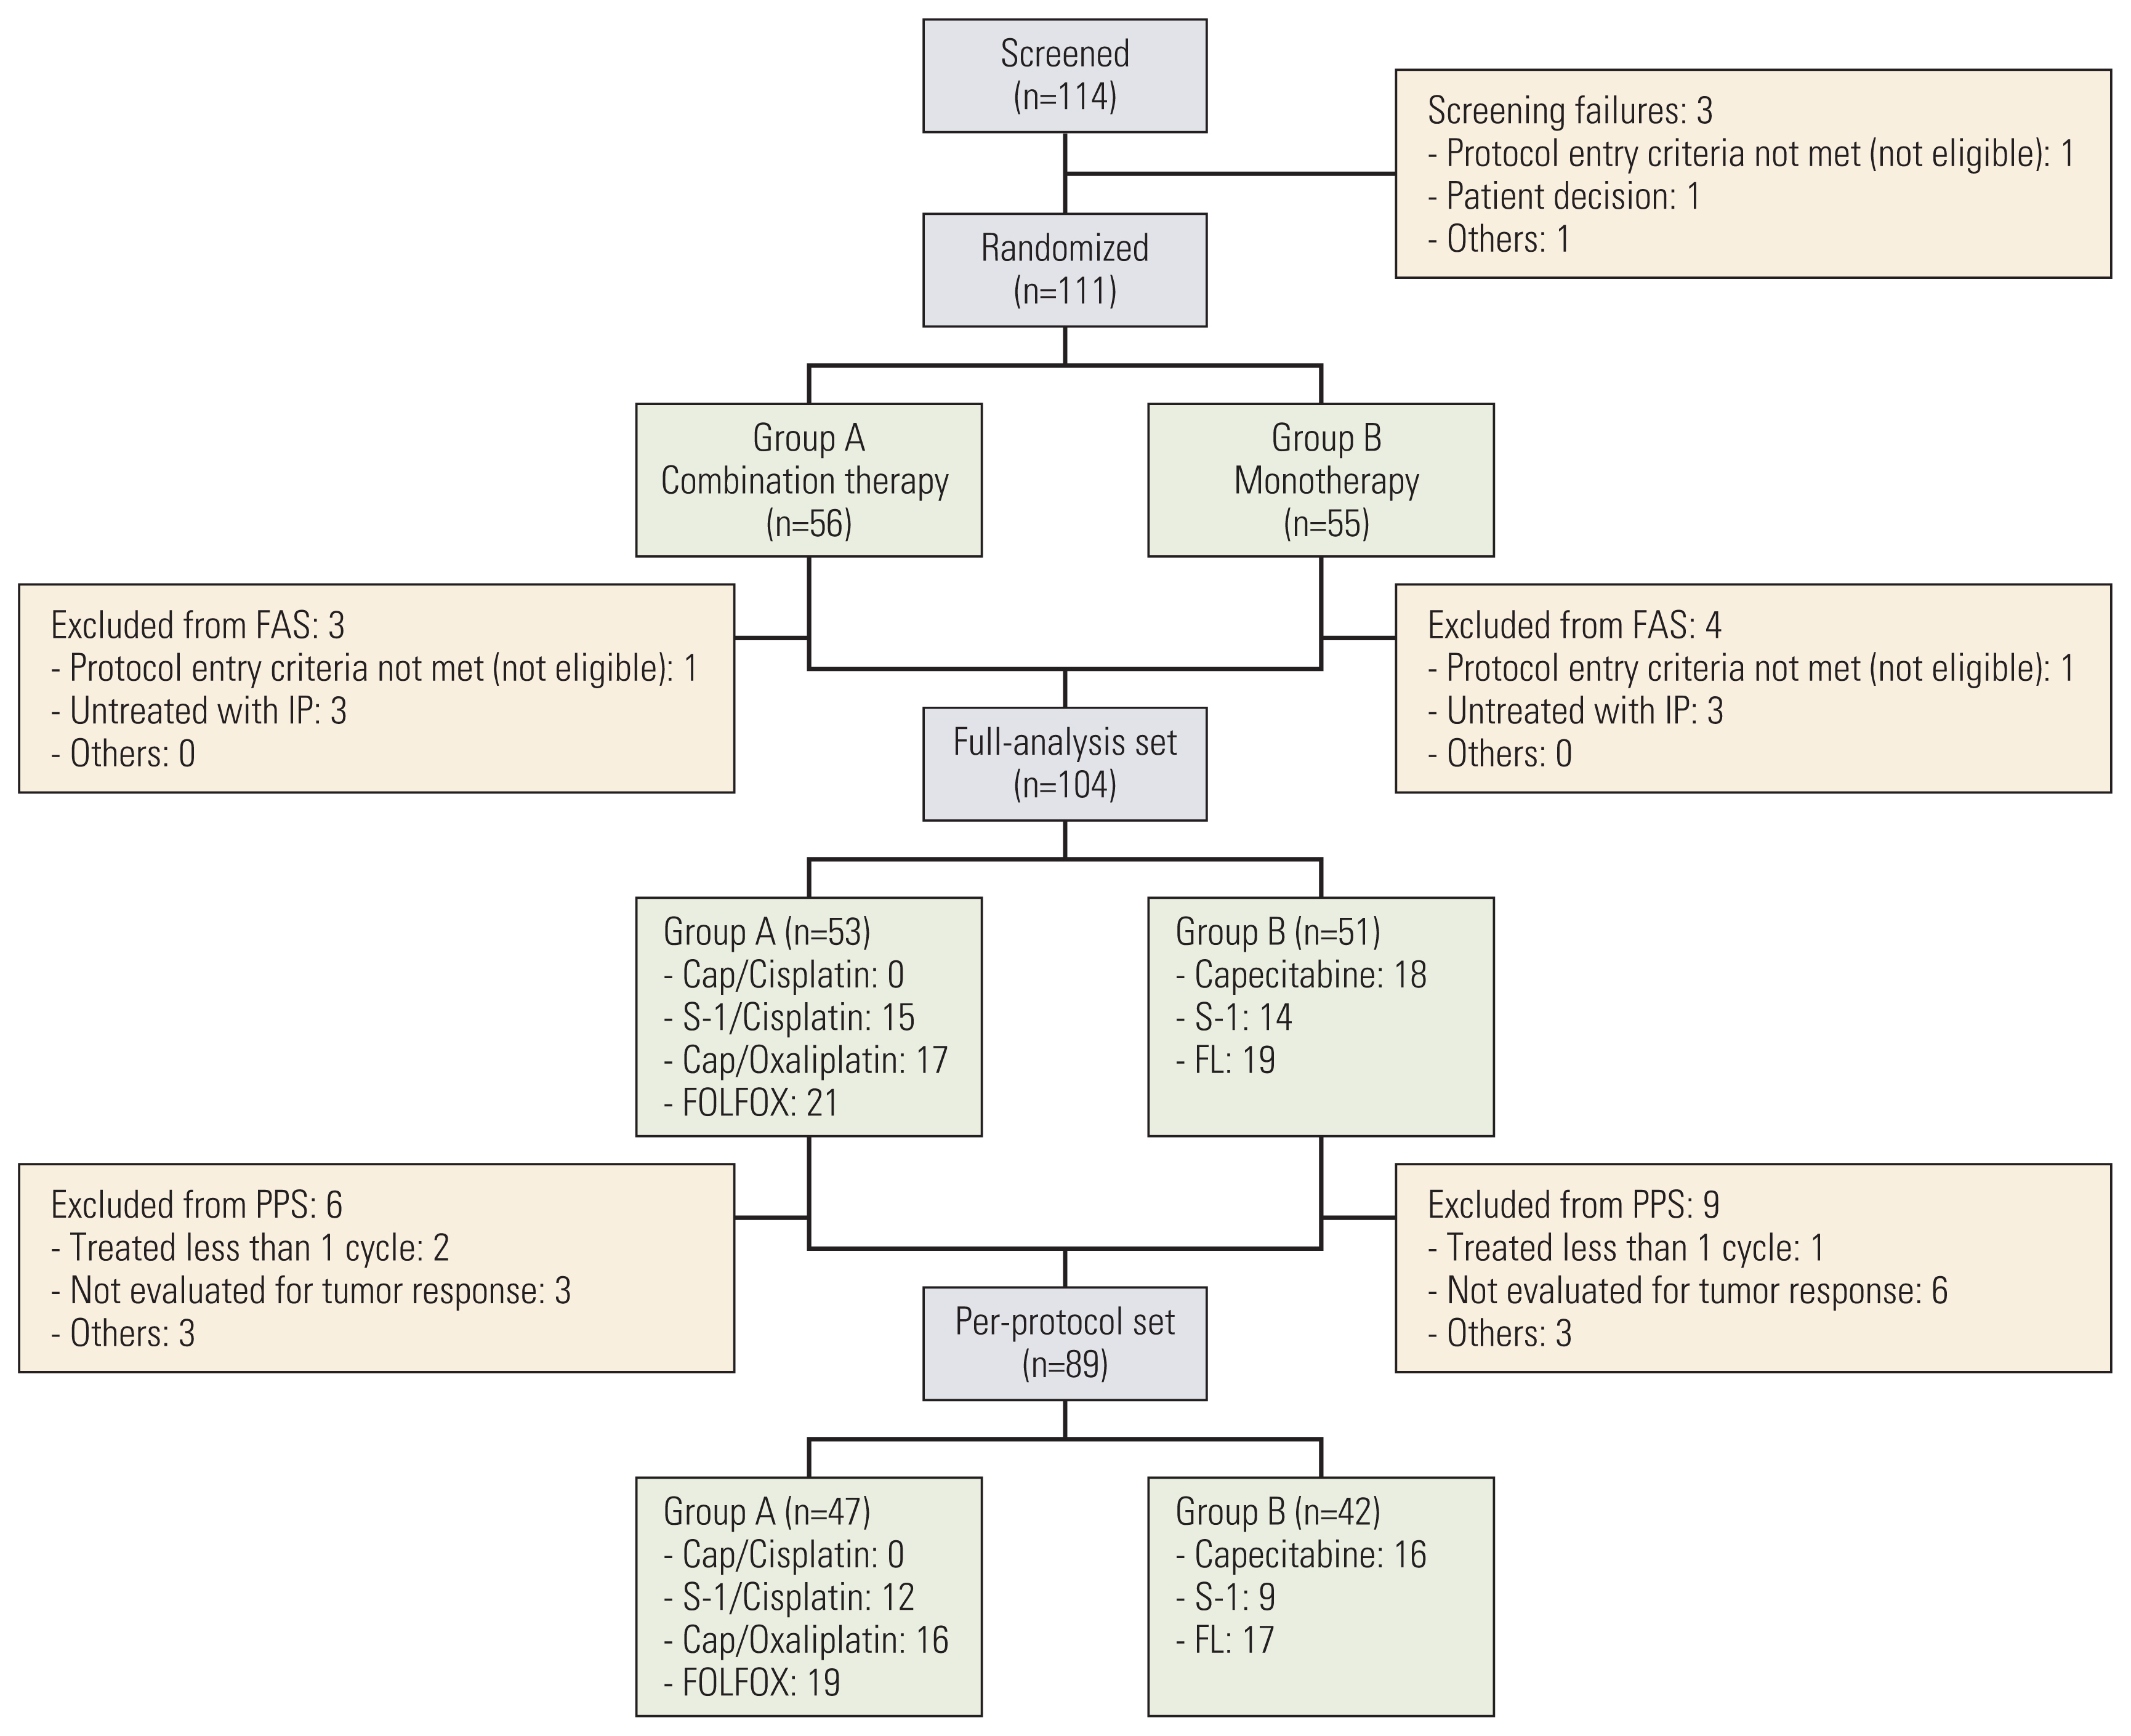
Between February 2014 and January 2019, after 111 of the planned 238 patients were randomized, further enrollment was terminated due to poor accrual. Among the 111 patients (S1 Table), seven did not meet the eligibility criteria or were not treated with the study treatment. Therefore, 104 patients were included in the FAS (Fig. 1).
The median age was 75 years (range, 70 to 88 years). Among the selected fluoropyrimidines, 5-FU accounted for 38%, capecitabine 34%, and S-1 28%. The baseline characteristics were well-balanced between the two groups (Table 2). In group A, FOLFOX was administered to 21 patients (40%), CAPOX 17 (32%), and S-1/cisplatin 15 (28%). In group B, FL was administered to 19 patients (37%), capecitabine 18 (35%), and S-1 14 (27%).
2. Delivery of study treatment
In the combination therapy group, among 48 patients who were alive and could receive further chemotherapy after the first cycle, only seven patients (15%) had dose escalation. The remaining patients sustained starting doses or required further dose reductions and/or interruptions related to AEs. The dose intensities (DIs) of platinum agents were in the range of 53%–65% in group A. The range of DIs of fluoropyrimidine agents was lower in group A than in group B (62%–71% vs. 83%–85%) (S2 and S3 Tables).
3. Efficacy
Efficacy analyses were primarily conducted in the FAS. During the follow-up period, death occurred in 90 patients. The median follow-up duration was 9.5 months (range, 0.3 to 71.2) for all patients as of the data cut-off date (February 28, 2020).
Prolongation of OS with combination therapy was not proven. Median OS of group A was numerically longer than that of group B (11.5 vs. 7.5 months); however, this was not statistically significant based on one-sided significance level of 0.05 (HR, 0.86; 95% confidence interval [CI], 0.56 to 1.30; p=0.231) (Fig. 2A). Second-line chemotherapy was administered to 21 patients (40%) in group A and 20 (39%) in group B.
In contrast, significant PFS prolongation was observed with combination therapy compared with monotherapy; median PFS 5.6 vs. 3.7 months (HR, 0.53; 95% CI, 0.34 to 0.83; p=0.005) (Fig. 2B). Tumor response was evaluated in 71 patients with measurable lesions. The ORR and disease control rate (DCR) were numerically higher in group A than in group B, but were not statistically significant (ORR, 34% vs. 25%; p=0.391; DCR, 77% vs. 58%, p=0.090) (Table 3).
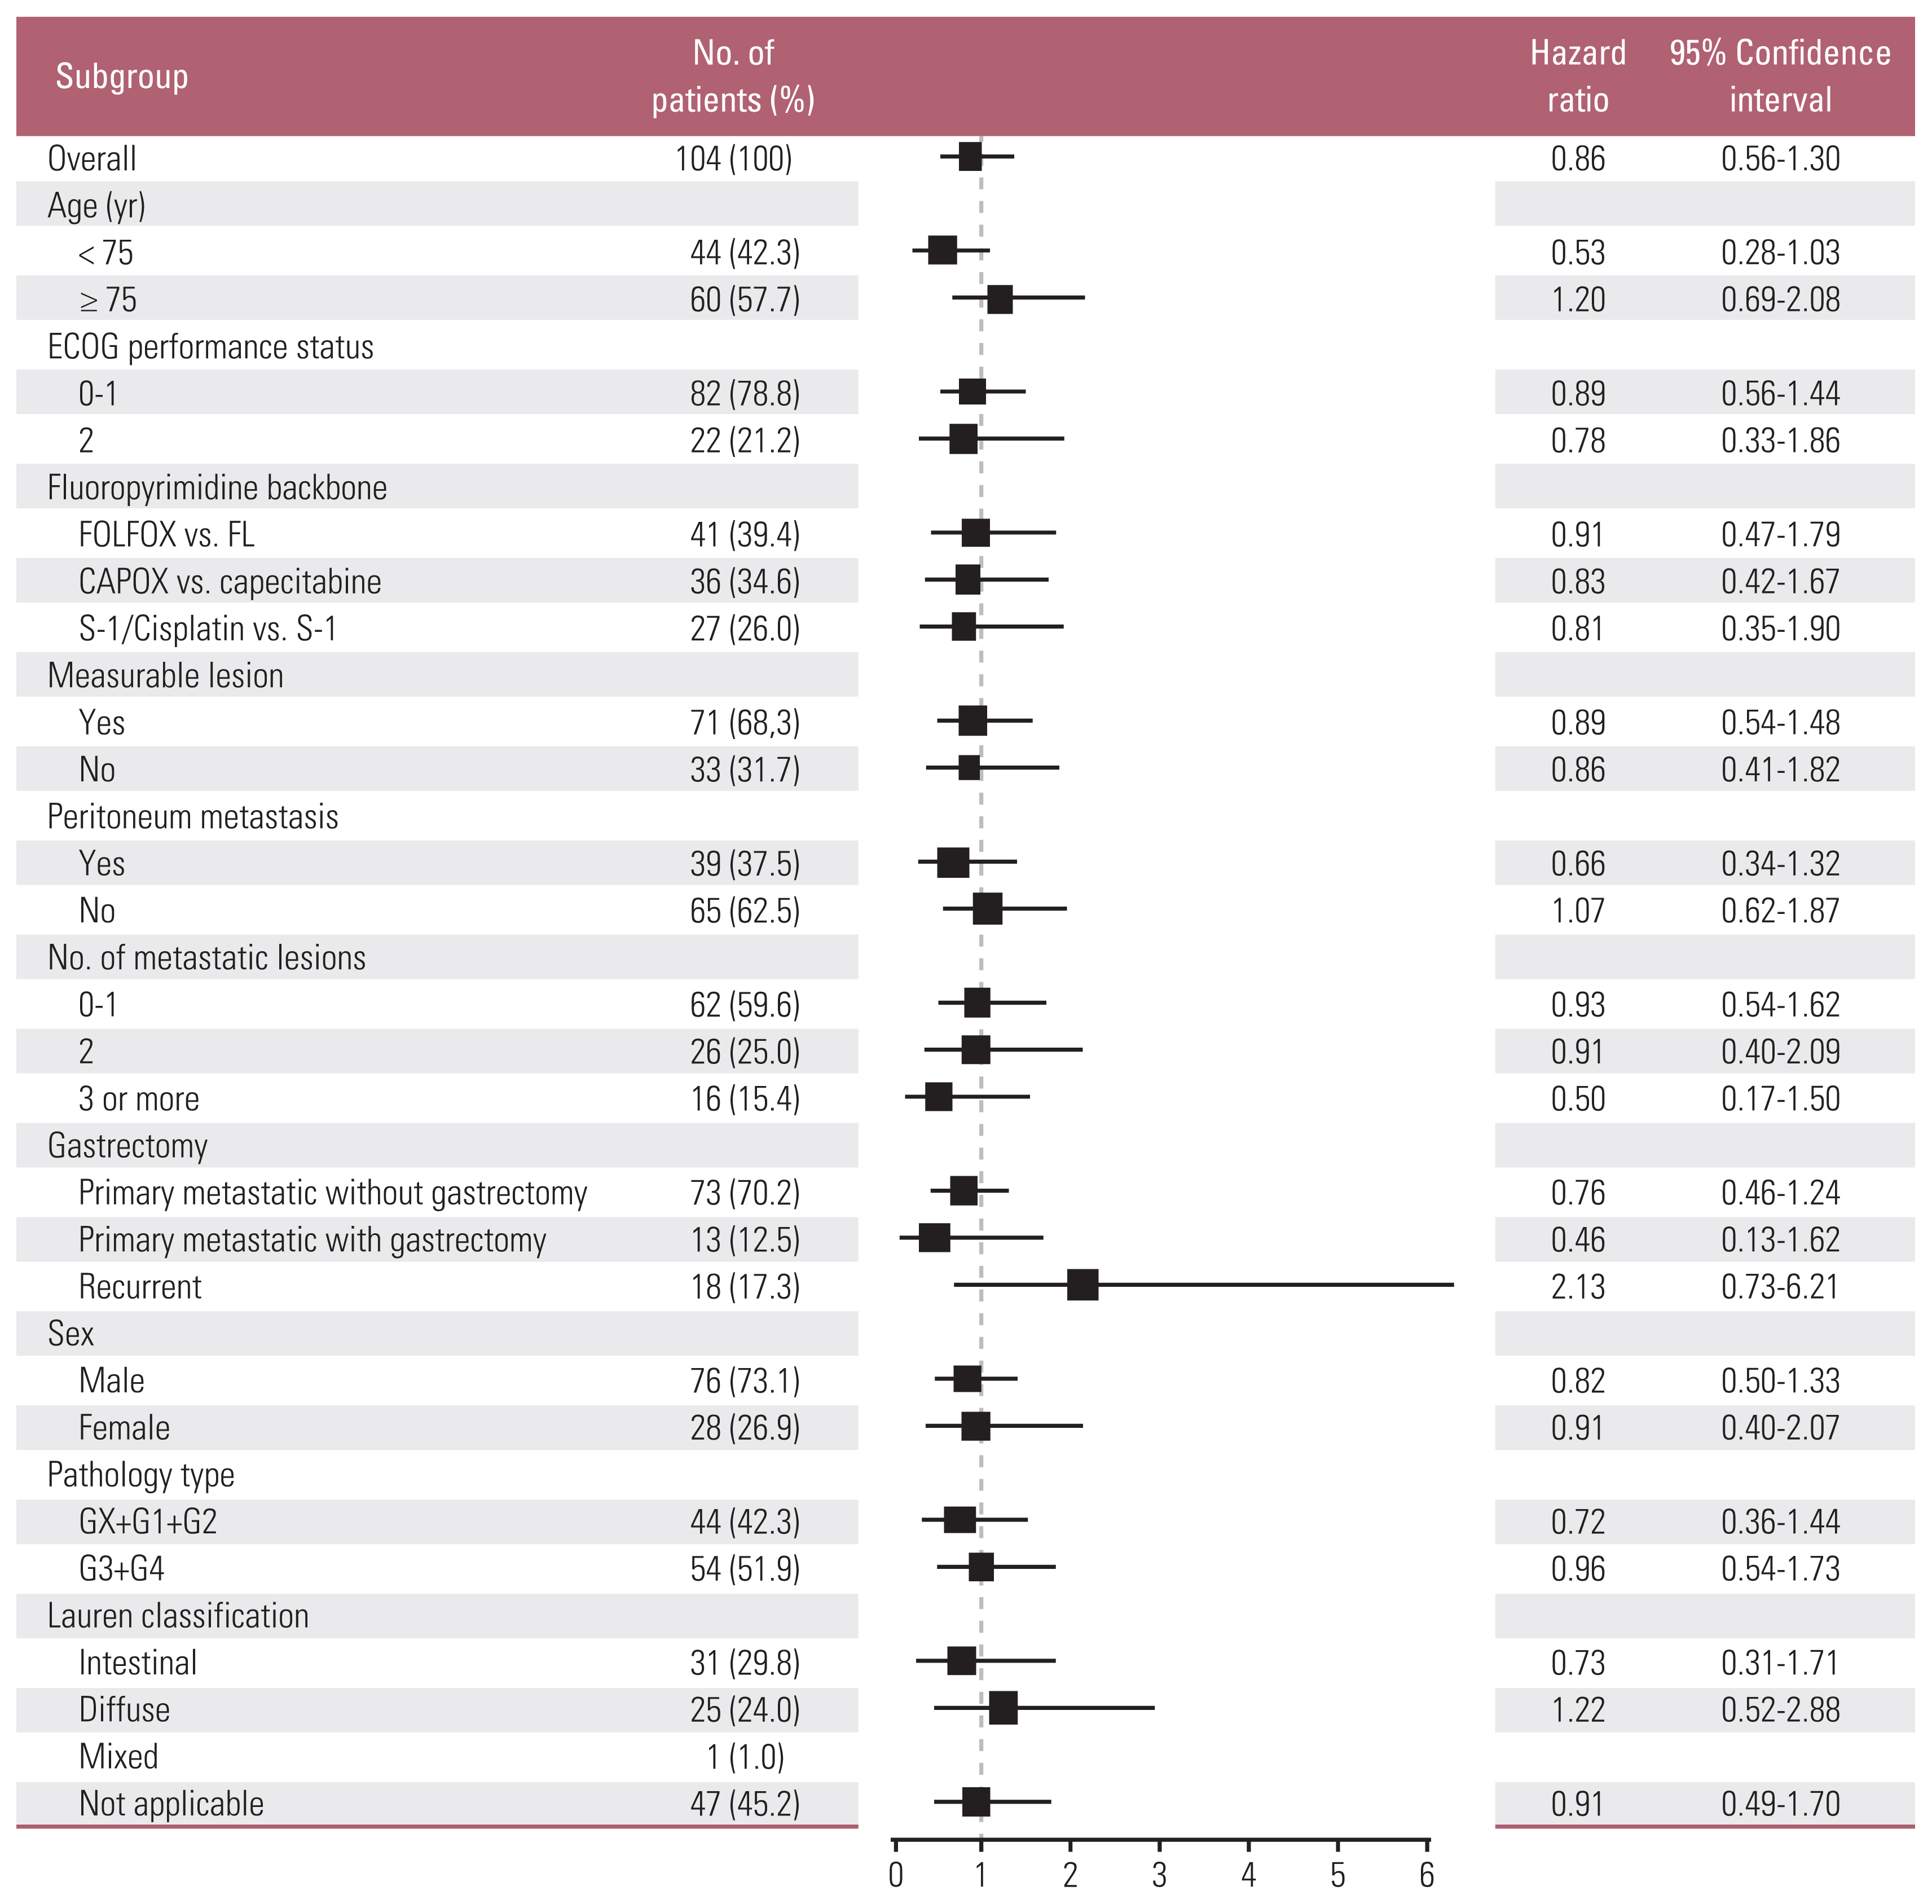
In preplanned subgroup analyses on OS, although we could not find any subgroups with significant OS differences, patients aged 70–74 years tended to have superior OS with combination therapy vs. monotherapy (15.9 vs. 7.2 months; HR, 0.53; 95% CI, 0.28 to 1.03; p=0.056) (Fig. 3). Planned survival analyses in the PPS (n=89) (Fig. 1) were also performed; the results were not different from those of FAS (S4 Table, S5 Fig.).
4. Adverse events
The treatment-related AEs (TRAEs) are shown in Table 4. Among TRAEs (all grades) with a frequency difference of > 10% between the two groups, neutropenia, thrombocytopenia, fatigue, anorexia, diarrhea, and peripheral neuropathy occurred more frequently in group A than in group B. Among TRAEs of ≥ grade 3, there were no AEs with a frequency difference of > 5%. The incidence of ≥ grade 3 peripheral neuropathy was 4% and 0% in groups A and B, respectively. There was one (1.9%) and two deaths (3.9%) in groups A and B, respectively, which could not deny a relationship with the study treatment.
5. Quality of life
At baseline, 102 of the 104 patients in the FAS completed the QOL questionnaires. Completion rates declined post-baseline mainly because of disease progression, with 17 patients (32%) in group A and five (10%) in group B completing the questionnaire at week 24. When we assessed the QOL changes during the study treatment using Osoba et al.’s method [17], most scales including EORTC QLQ-C30 global health status/QOL and functioning scales showed “no” or “a little” change (a change of 5–10 points from baseline). “Moderate” change (a change of 10–20 points from baseline) was observed in several symptom scales in group B; dyspnea, insomnia, appetite loss, and dry mouth were found to worsen from weeks 12 to 24, and body image showed aggravation from weeks 6 to 12. In group A, diarrhea showed “moderate” aggravation at the 6th week, but gradually improved thereafter. We did not observe “very much” change (a change of > 20 points from baseline) in either group (S6 Fig.).
When the treatment effect over time was tested using a mixed model for repeated measures analysis, there were no significant between-group differences for all the QOL scales except dyspnea (S7 and S8 Tables). A worsening in dyspnea was observed from weeks 12 to 24 in group B, in contrast to almost no change throughout the course in group A.
Discussion
In this phase 3 trial of first-line chemotherapy for elderly patients with MRGC, although combination therapy showed a significant PFS benefit compared with monotherapy, the prolongation of OS was not proven. Failure to demonstrate statistically significant OS prolongation with combination therapy may be attributable to the small sample size related to the premature termination of this study. However, the numerically improved median OS outcomes (Δ=4.0 months) provided by the combination therapy appear to be clinically meaningful. The OS curve for combination therapy was consistently higher than that for monotherapy until 18 months after chemotherapy initiation (Fig. 2A). At the time point of 18 months, only 16 patients remained in the OS analysis, and the two curves showed nearly parallel progression until the data cut-off date, suggesting that some patients with relatively indolent tumor biology were included. In addition, about 40% of patients in both groups received subsequent chemotherapy. Regarding second-line chemotherapy regimens, eight patients (40%, 8/20) received FOLFOX in monotherapy group (group B). Ramucirumab/paclitaxel, the current standard second-line treatment, was only administered to five patients (24%, 5/21) in group A and two (10%, 2/20) in group B, respectively, because the cost of ramucirumab has been covered by the National Health Insurance in Korea since May 2018 (S9 Table). Implementation of these subsequent treatments seems to have diluted the difference in OS between the two groups.
In preplanned subgroup analyses, patients aged 70–74 years had a stronger tendency toward a longer OS with combination therapy (Fig 3). In addition, combination therapy showed a clear PFS benefit (Fig. 2B). Overall, these efficacy outcomes suggest the benefit of combination therapy over monotherapy in elderly patients with MRGC, especially those aged 70–74 years. In the subgroup analysis of 18 recurrent cases, median OS of group A was numerically shorter than that of group B (9.3 vs 16.1 months; HR, 2.13; 95% CI, 0.73 to 6.21; p=0.154) (Fig. 3). Median disease-free interval from surgery was 29 months (range, 9 to 54 months) in group A (n=11) and 36 months (range, 4 to 280 months) in group B (n=7). A small number of patients and a wide range of disease-free interval in this subgroup make it difficult to reach a clear conclusion about the difference in OS benefit of combination therapy for the recurrent vs. primary metastatic cases.
The results of our study were consistent with those of a few trials conducted on elderly patients [13,14]. The median OS and PFS of 7.5 and 3.7 months with monotherapy, respectively, in our study were like those of a randomized phase 2 trial of fluoropyrimidine monotherapies in elderly patients with MRGC [13]. In a previous small phase 3 trial, only 50 chemo-naïve elderly patients (≥ 70 years) were randomized, and CAPOX showed a trend of increased OS compared with capecitabine monotherapy (11.1 vs. 6.3 months), although statistically insignificant. The trial was prematurely closed because of the unexpectedly low efficacy of capecitabine monotherapy seen in the interim analysis; thus, it was difficult to draw a definitive conclusion [14]. Our study enrolled a larger number of patients than those studies [13,14]; however, it still could not include a sufficient sample size, which reaffirmed the difficulty of conducting large-scale randomized trials in geriatric cancer patients.
Both combination therapy and monotherapy were well tolerated. The risk of TRAEs of ≥ grade 3 did not significantly increase with combination therapy. QOL was maintained and did not differ significantly between the two groups during the treatment. Regarding DIs of chemotherapeutic agents, in the combination therapy group, patients were initially treated with reduced doses (80% of standard doses), and most of them sustained starting doses or needed further dose reductions related to AEs. In our study, reduced doses of combination therapy resulted in improved outcomes without an increase in major toxic effects. Our results are supported by the results of a recent randomized phase 2 trial designed for frail and/or elderly patients with advanced gastroesophageal cancer considered unfit for conventional dose chemotherapy, in which reduced doses of CAPOX was found to be most likely to provide clinical benefit [18]. The following GO2 phase 3 trial compared three dose levels (level A [reference]; level B [doses 0.8 times A]; level C [doses 0.6 times A]) of CAPOX. Non-inferior PFS was confirmed for levels B and C compared with level A. In addition, level C showed fewer toxic effects and better overall treatment utility (OTU) than level A or B [19].
This study had some limitations. First, the study could not reach a sufficient sample size to identify statistical differences in OS. Elderly patients continue to be underrepresented in cancer clinical trials, and several factors related to lower accrual rates in elderly patients have been suggested [20–23]. Second, geriatric assessment (GA) can help identify patients’ vulnerabilities other than chronological age and ECOG PS and has been reported to predict the toxicity of chemotherapy [24–26] and survival [27,28]. However, we were not able to collect data on full GA in most of the patients because it was optional and not easy to implement in oncology clinics with high clinical burden and limited resources. Third, for elderly patients, patient-centered outcomes such as OTU could have provided more information about meaningful benefits than survival. Instead, we measured QOL in addition to disease-specific outcomes in this study.
In conclusion, combination therapy was well tolerated and associated with numerically improved OS compared with monotherapy in elderly patients with MRGC, especially in those aged 70–74 years, although statistically insignificant. Our findings add to increasing evidence that fluoropyrimidine plus platinum combination therapy with appropriately adjusted doses can be considered a standard first-line treatment in elderly patients with MRGC.