Introduction
Although the mortality rate has decreased significantly due to enhanced screening, earlier detection and improved treatment, colorectal cancer (CRC) continues to be the fourth most deadly cancer after lung cancer, liver cancer, and stomach cancer [1]. Surgery is the primary curative treatment for non-metastasized CRC [2,3], while adjuvant chemotherapy is usually recommended for high-risk stage II or stage III tumors [4]. However, even for patients in the same stage, prognosis can vary; therefore identification of prognostic markers and accurate prediction of prognosis is required for improving the current therapeutic approach. Inflammatory markers as well as genetic and epigenetic markers have been studied, but biomarkers that are simpler and easier to obtain are preferable [5–7].
The albumin-bilirubin (ALBI) score was first used to estimate liver dysfunction severity in patients with hepatocellular carcinoma (HCC), and the ALBI score is reported to be a simple and objective method for assessing liver function in these patients [8]. The prognostic value of ALBI score has also been observed in other cancers including CRC [9,10].
Previous studies have demonstrated that the change in ALBI score after treatment is a significant factor in predicting prognosis, represented by overall survival (OS) in HCC patients [11,12]. A study performed on patients who underwent hepatectomy for HCC showed that higher postoperative ALBI score and ALBI changes after hepatectomy were independent predictors of inferior OS and recurrence-free survival [12]. Another study focused on changes in the ALBI score in association with prognosis in the patients with chronic hepatitis C–HCC receiving trans-arterial chemoembolization and concluded that ALBI score change and baseline ALBI score are independent predictive factors for tumor recurrence and OS [13]. To our knowledge, little is known about the prognostic significance of ALBI score change in CRC patients.
Thus, this study aimed to evaluate the prognostic value of ALBI score change before and after surgery in comparison to ALBI score before or after surgery alone in patients with CRC.
Materials and Methods
1. Patients
Patients who underwent CRC surgery at the Gangnam Severance Hospital of Yonsei University College of Medicine between April 2006 and March 2014 were included. A total of 1,453 patients were enrolled in the study. Exclusion criteria for study population selection were as follows: (1) patients with appendiceal cancer, anal cancer, and uncertain location information; (2) those with other types of cancer including neuroendocrine tumor and gastrointestinal stromal tumor; (3) patients with cancer stage 0 or missing stage information; (4) those who were diagnosed with hereditary nonpolyposis CRC or familial adenomatous polyposis associated cancers; (5) patients who had undergone preoperative chemoradiotherapy or emergency operation; (6) those with double primary cancer or inflammatory bowel disease-associated cancer; and (7) those without available ALBI score in the preoperative and postoperative periods. The detailed inclusion criteria are illustrated in the S1 Fig.
2. Patient management and follow-up
Chemotherapy was indicated for either patients in stage II with high risk, stage III, or stage IV. Patient recovery status and recommended guidelines for postoperative chemotherapy were main considerations in the choice of chemotherapy agent. Consent with patients were made before chemotherapy was administered.
Height, weight, albumin, bilirubin, and carcinoembryonic antigen (CEA) levels were obtained from the medical records. For each patient, tumor-associated information, such as location, size, histologic grade, lymphovascular invasion (LVI), and stage was extracted. The patients were followed up in an outpatient setting every 3–6 months base. Basic lab, abdomino-pelvic or chest computed tomography (CT) and evaluation of CEA level was done. Follow-up colonoscopy was recommended at 1, 3, or 5 years after surgery. Pelvic magnetic resonance imaging or positron emission tomography/CT was selectively performed according to the patients’ characteristics.
3. Defining of ALBI-pre, ALBI-post and ALBI-trend
According to a previous study, the ALBI score was calculated using the formula: ALBI=(log10 total bilirubin concentration [μmol/L]×0.66)+(albumin concentration [g/L]×−0.0852) [8]. For this analysis, ALBI scores were calculated twice, before the surgery and between 3 and 8 weeks after the surgery. Scores measured before and after surgery were defined as ALBI-pre and ALBI-post scores, respectively. According to the score, every patient was classified into two groups: ≤ −2.60 as low ALBI group and > −2.60 as high ALBI group.
The combined effect of ALBI-pre and ALBI-post scores was tested by setting a new variable named ALBI-trend, which was defined in the following manner: ALBI-trend group 1 was defined as patients with low ALBI-pre and ALBI-post scores, group 2 was defined as patients having low ALBI-pre but high ALBI-post scores, group 3 as patients with high ALBI-pre but low ALBI-post scores, and group 4 as patients having high ALBI-pre and ALBI-post scores.
4. Statistical analysis
For each numerical variable, the commonly used cutoff values were set to change numerical variables into categorical variables. All variables were expressed as the number of patients (percentage) and were compared between the low and high ALBI score groups. The chi-square test was used to determine whether there was a significant difference between the categorical variables.
OS was defined and calculated as the time span between the date of surgery and the date of death or last follow-up. The Kaplan-Meier method was used to estimate the OS. Log-rank test was performed to compare survival between the groups. The Cox proportional hazards model was used to test whether the ALBI scores influenced OS. Variables with p < 0.05 in the univariable analysis were selected and included in the multivariable analysis.
Harrell’s concordance index (C-index) values were calculated with bootstrap and were compared to examine the correlation of OS with ALBI-pre, ALBI-post, and ALBI-trend score groups.
All statistical analyses were performed using R ver. 4.2.0 (R-project, Institute for Statistics and Mathematics, Vienna, Austria). Statistical significance was set at p < 0.05.
Results
1. Patient characteristics
A total of 723 patients were included in this study. When grouped according to the ALBI-pre score, 586 patients (81.1%) were classified as having low ALBI-pre score, while 137 patients (18.9%) were categorized as presenting with a high ALBI-pre score. Meanwhile, when classified according to the ALBI-post score, 615 patients (85.1%) were classified as having a low ALBI-post score, and 108 patients (14.9%) were categorized as presenting with a high ALBI-post score. According to the ALBI-trend, 523 (72.3%), 63 (8.7%), 92 (12.7%), and 45 (6.2%) patients were classified into groups 1, 2, 3, and 4.
2. Association between the ALBI score and clinicopathological parameters
Patient characteristics were compared between the low and high ALBI groups, both for ALBI-pre and ALBI-post scores (Table 1). For the ALBI-pre score, patients classified into the high ALBI-pre score group were older (p < 0.001), had a lower body mass index (p=0.004), had colon cancer more frequently (p < 0.001), had larger tumor size (p < 0.001), were classified as stage IV with a higher frequency (p=0.013), had a higher complication rate (p=0.001), and had a lower administration rate of chemotherapy (p < 0.001) compared to those in the low ALBI-pre score group. Meanwhile, there were no significant differences regarding sex, CEA level, histologic grade, and LVI.
Considering the ALBI-post score, patients in the high ALBI-post score group had a higher ratio of males (p=0.003), were older (p < 0.001), had a higher level of CEA (p=0.048), had a higher complication rate (p < 0.001), and had a lower administration rate of chemotherapy (p < 0.001) than those in the low ALBI-post score group. No significant difference was found between the two groups regarding body mass index, tumor location, tumor size, histologic grade, LVI, and tumor stage.
When we considered metastatectomy in stage IV patients, R0 resection was more commonly performed in patients with the low ALBI-pre group than the high ALBI-pre group (p=0.002). However, there was no difference between the low ALBI-post group and the high ALBI-post group (p > 0.99).
3. Comparison of patient characteristics between different ALBI-trend groups
Patient characteristics were compared between the groups according to ALBI-trend (Table 2, S2 and S3 Tables). Group 2 included patients who were in the low ALBI score group before surgery and changed to the high ALBI score group after surgery. When compared to group 1, group 2 had higher ratio of males (p=0.028), older age (p=0.003), more patients with rectal tumor (p=0.002), higher percentage of patients with stage IV cancer (p=0.013), higher complication rate (p < 0.001), and lower chemotherapy receipt rate (p < 0.001) (S2 Table).
In addition, group 3 included patients who were in the high ALBI score group before surgery and changed to the low ALBI score group after surgery. Group 3 had a younger age (p=0.004), lower complication rate (p < 0.001), and lower chemotherapy administration rate (p=0.022) in comparison to group 4 (S3 Table).
4. Comparison of ALBI-associated parameters between liver metastasis and no liver metastasis in stage IV patients (n=111)
In stage IV patients, ALBI score group and ALBI-trend were compared between patients who had liver metastasis or not. The liver metastasis group was defined to include patients with only liver metastasis and patients with both liver metastasis and other organ metastases. There was no difference of preoperative or postoperative ALBI score and ALBI-trend between the two groups (S4 Table).
5. Comparison of OS between different ALBI groups
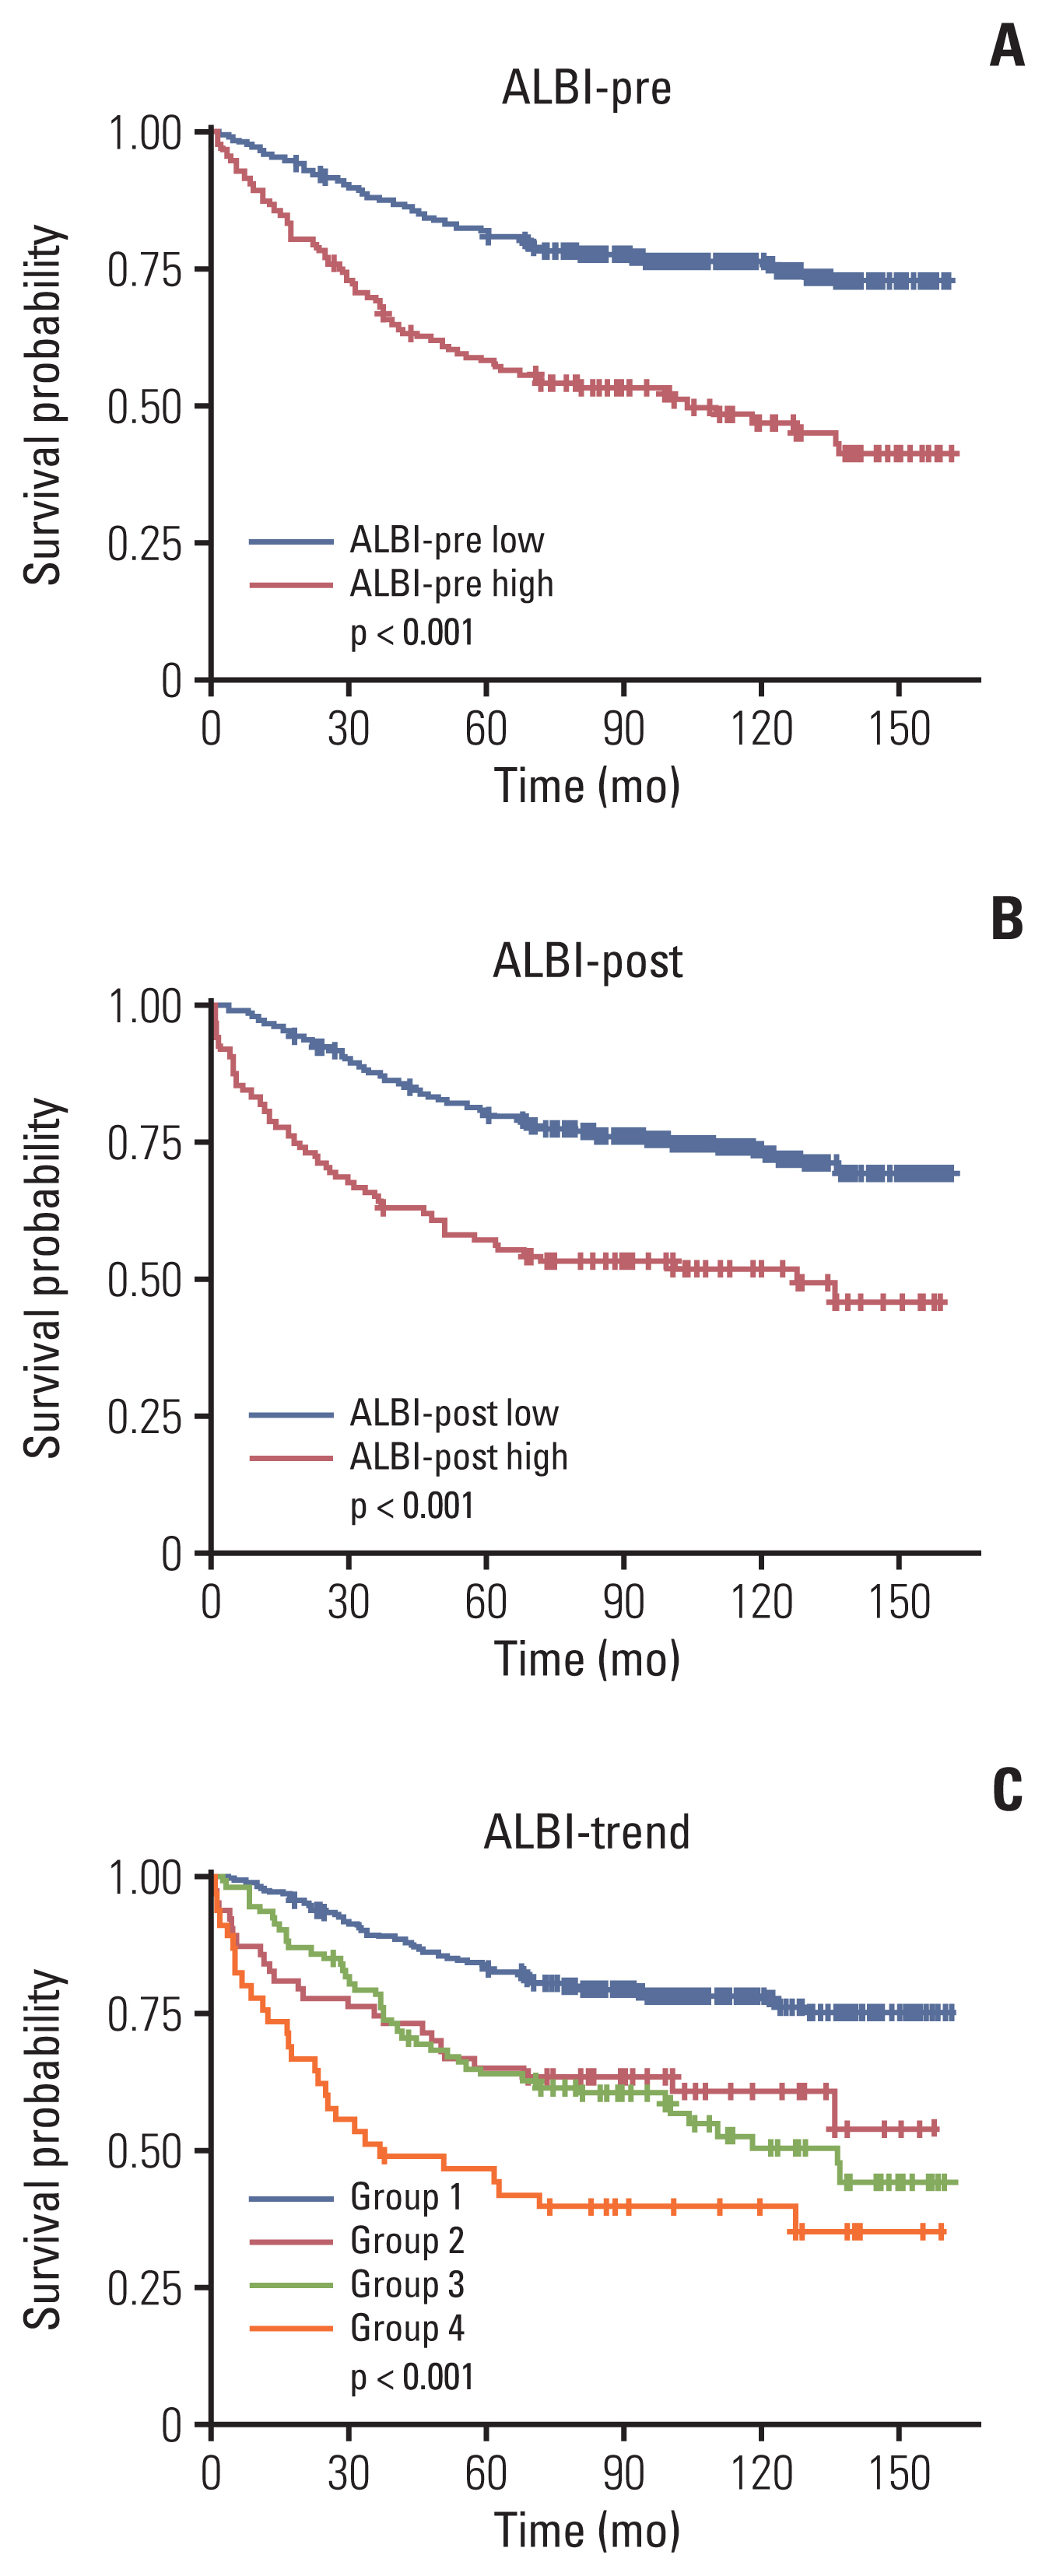
Kaplan-Meier curves showed that the 5-year OS rate of the high ALBI-pre score group was significantly worse than that of the low ALBI-pre score group (58.1% vs. 81.5%, p < 0.001) (Fig. 1A). Similarly, the 5-year OS rate of the high ALBI-post group was significantly lower than that of the low ALBI-post score group (56.4% vs. 80.5%, p < 0.001) (Fig. 1B). OS differed significantly between the ALBI-trend groups; group 1 had preferable survival, while group 4 had lower OS (5-year OS rates of 83.5%, 65.1%, 63.8%, and 44.2% for groups 1, 2, 3, and 4, respectively; p < 0.001) (Fig. 1C).
6. Comparison of OS between liver metastasis and no liver metastasis in stage IV patients (n=111)
There was no difference of OS between ALBI-trend in patients with liver metastasis patients (p=0.066) (n=76), while there was difference of OS in patients without liver metastasis (p=0.001) (n=35) (S7 Fig.). There was significant difference of OS between ALBI-pre high and ALBI-pre low in patients with liver metastasis (p=0.012) and without liver metastasis (p=0.006) respectively (S8 Fig.).
7. Univariable and multivariable analysis of OS
Univariable analysis revealed that poor OS was correlated with male sex (hazards ratio [HR], 1.358, p=0.036), age ≥ 70 years (HR, 1.967; p < 0.001), CEA ≥ 5 ng/mL (HR, 1.958; p < 0.001), tumor size ≥ 5 cm (HR, 1.591; p < 0.001), presence of complications (HR, 1.634, p=0.003), presence of LVI (HR, 2.133; p < 0.001), advanced tumor stage (stages I and II vs. stage III: HR, 1.630; p=0.005; stages I and II vs. stage IV: HR, 5.405; p < 0.001), no administration of chemotherapy (HR, 0.316; p < 0.001), high ALBI-pre score group (HR, 2.682; p < 0.001), high ALBI-post score group (HR, 2.474; p < 0.001), and higher ALBI-trend groups (group 1 vs. group 2: HR, 2.172; p < 0.001; group 1 vs. group 3: HR, 2.459; p < 0.001; group 1 vs. group 4: HR, 4.392; p < 0.001).
In multivariable analysis, the ALBI-trend group (group 1 vs. group 2: HR, 1.649; p=0.028; group 1 vs. group 3: HR, 2.235; p < 0.001; group 1 vs. group 4: HR, 2.477; p < 0.001) remained as an independent prognostic factor, while ALBI-pre and ALBI-post scores were not (Table 3).
8. Comparison of stratification performance among the ALBI-pre, ALBI-post, and ALBI-trend
The stratification performance of the ALBI-trend classification was compared with that of ALBI-pre and ALBI-post. The C-index of the ALBI-trend (0.622; 95% confidence interval [CI], 0.587 to 0.655) was higher than that of ALBI-pre (0.589; 95% CI, 0.557 to 0.621) (bootstrap mean difference, 0.033; 95% CI, 0.013 to 0.057) and ALBI-post (0.575; 95% CI, 0.545 to 0.605) (bootstrap mean difference, 0.047; 95% CI, 0.024 to 0.074) (Table 4).
9. Comparison of stratification performance between ALBI-trend and albumin
The stratification performance of the ALBI-trend was compared with that of albumin. The C-index of the ALBI-trend (0.622; 95% CI, 0.587 to 0.655) was higher than that of albumin (0.572; 95% CI, 0.546 to 0.589) (bootstrap mean difference, 0.051; 95% CI, 0.023 to 0.08) (S9 Table).
Discussion
Our study demonstrated that ALBI-trend, which combined preoperative and postoperative ALBI scores, was significantly associated with OS. Moreover, multivariable analysis showed that ALBI-trend was an independent prognostic factor while preoperative and postoperative ALBI scores were not selected. According to the C-index comparison, ALBI-trend could improve risk stratification compared to the single use of ALBI score in either preoperative or postoperative stages in patients with CRC.
ALBI score is a useful tool for objectively evaluating liver function. Its prognostic value in liver cancer and cirrhosis is well-known [8,14,15]. Previous studies have also investigated the relationship between ALBI score and prognosis in patients with various cancers including advanced pancreatic cancer, gastric cancer, non-small cell lung cancer, and CRC [9,16–18]. Zhu et al. [18] present two possible reasons for the association between ALBI grade and survival in gastric cancer patients. The first one is that a high ALBI score is accompanied by malnutrition, which causes immunodeficiency and accelerates tumor progression. The second possible mechanism is that malnutrition and liver dysfunction are major factors leading to adverse reactions to chemotherapy; since patients with advanced gastric cancer have survival benefits from postoperative chemotherapy, a low survival rate is associated with a high ALBI score [18]. According to our recent study, ALBI grade was significantly associated with myosteatosis, suggesting that ALBI grade may be related to systemic inflammation-associated malnutrition [9]. Nevertheless, further research on the mechanism is needed to determine the underlying cause.
Previous studies have demonstrated that ALBI score change after treatment is important in predicting prognosis [11,12]. Kuo et al. [11] showed that the change in ALBI score after sorafenib treatment independently predicted OS and that ALBI score change during sorafenib treatment may reflect hepatic reserve in patients with HCC. Ye et al. [12] showed that a higher postoperative ALBI score and ALBI changes after hepatectomy were independent predictors of inferior OS and recurrence-free survival. This result showed that a change in the ALBI score indicated the liver reserve function and invasiveness of HCC, which is correlated with prognosis [12]. However, when the ALBI score should be measured postoperatively remains unclear. Currently, the interval between two consecutive ALBI score measurements is either not constant [11], or ALBI is measured 1 day after surgery in some cases [12]. Furthermore, the reasons for the change in ALBI score are yet unidentified in other types of cancer, but differences in how patients react to various events encountered during treatment are considered as a possible explanation.
In our study, ALBI scores changed significantly before and after surgery in some patients. Considering that group 2 had increased ALBI scores after surgery unlike group 1, patient features including male sex (p=0.028), older age (p=0.001), more cases of rectal tumor (p=0.002), higher ratio of stage IV cancer (p=0.013), higher complication rate (p < 0.001), and lower chemotherapy receipt rate (p < 0.001) were related to increased ALBI score. In addition, group 3 (high ALBI-pre but low ALBI-post score) had younger patients (p=0.004), lower complication rate (p < 0.001), and higher chemotherapy administration rate (p=0.022) compared to group 4. A simplified explanation would not clarify every aspect, but it is known that postoperative complications occur at a higher rate in old age and rectal cancer has a higher risk of postoperative morbidity than colon cancer [4,19]. Considering that the rate of chemotherapy administration may also be affected by postoperative complication rate, age, or tumor location, changes in the ALBI score are likely to be closely related to the presence of postoperative complications [19].
In our analysis, complications were identified as an indicative factor of poor prognosis only in univariable analysis, and were found to be meaningless in multivariable analysis. We speculate that this may be due to the strong correlation of complications with the changed pattern of ALBI-trend. However, postoperative complications including anastomotic leakage, anastomotic bleeding, and intestinal obstruction are well-known poor prognostic factors in patients with CRC [20]. It is difficult to explain all our results based on the presence or absence of complications. However, it is highly likely that increased systemic inflammation following postoperative complications affected the change in ALBI-post score. Previous studies have suggested that systemic inflammation induces low food intake and anorexia, leading to malnutrition, increased protein breakdown rate, and lowered serum albumin level [21,22]. This, in turn, would result in a higher ALBI score postoperatively. It is also known that bilirubin reduces immune cell activation and systemic inflammation [23]. Further studies are needed on the mechanism by which the ALBI score is affected by systemic inflammation.
This study has some limitations. First, this was a single-center retrospective study. Second, the ALBI-post score was not measured at regular intervals after surgery. In order to lessen bias coming from varying measurement times, ALBI-post score measured at least 3 weeks after surgery was selected. Most of the time, ALBI-post score was measured between 3 and 8 weeks after surgery and the nearest data point to 3 weeks was selected in our analysis. A minimum time interval of 3 weeks was set considering the time for termination of acute host response to surgery so that acute inflammation would not skew the result. Moreover, it is recommended to start chemotherapy within 8 weeks in a clinical setting; the score would therefore be a useful indicator if it is measured before 8 weeks from surgery and put into clinical use. Further prospective studies shall aim to overcome these limitations.
In conclusion, this study showed that combining preoperative and postoperative ALBI scores is an independent prognostic factor of OS in patients who undergo CRC surgery and has better predictive power than ALBI-pre or ALBI-post score alone. Measuring the ALBI score is easy, cost effective, and it can be measured before treatment plan is made; it is therefore important in predicting survival and determining treatment plan.