| Home | E-Submission | Sitemap | Contact Us |  
top_img
Cancer Research and Treatment > Volume 53(2); 2021 > Article
Tang, Tang, Mao, Li, Chen, Zhang, Guo, Liu, Sun, Xu, and Ma: The Pattern of Time to Onset and Resolution of Immune-Related Adverse Events Caused by Immune Checkpoint Inhibitors in Cancer: A Pooled Analysis of 23 Clinical Trials and 8,436 Patients

Abstract

Purpose

The occurrence pattern of immune-related adverse events (irAEs) induced by immune checkpoint inhibitor (ICI) in cancer treatment remains unclear.

Materials and Methods

Phase II–III clinical trials that evaluated ICI-based treatments in cancer and were published between January 2007 and December 2019 were retrieved from public electronic databases. The pooled median time to onset (PMT-O), resolution (PMT-R), and immune-modulation resolution (PMT-IMR) of irAEs were generated using the metamedian package of R software.

Results

Twenty-two eligible studies involving 23 clinical trials and 8,436 patients were included. The PMT-O of all-grade irAEs ranged from 2.2 to 14.8 weeks, with the longest in renal events. The PMT-O of grade ≥ 3 irAEs was significantly longer than that of all-grade irAEs induced by programmed cell death protein 1 (PD-1) and its ligand 1 (PD-L1) inhibitors (27.5 weeks vs. 8.4 weeks, p < 0.001) and treatment of nivolumab (NIV) plus ipilimumab (IPI) (7.9 weeks vs. 6.0 weeks, p < 0.001). The PMT-R of all-grade irAEs ranged from 0.1 to 54.3 weeks, with the shortest and longest in hypersensitivity/infusion reaction and endocrine events, respectively. The PMT-IMR of grade ≥ 3 irAEs was significantly shorter than that of all-grade irAEs caused by PD-1/PD-L1 blockade (6.9 weeks vs. 40.6 weeks, p=0.002) and NIV+IPI treatment (3.1 weeks vs. 5.9 weeks, p=0.031).

Conclusion

This study revealed the general and specific occurrence pattern of ICI-induced irAEs in pan-cancers, which was deemed to aid the comprehensive understanding, timely detection, and effective management of ICI-induced irAEs.

Introduction

Immune checkpoint inhibitors (ICIs) have opened a new era of cancer management through the leverage of the immune system’s potential and have become one of the mainstays of antitumor treatment [1]. The activation and proliferation of T cells are modulated by certain inhibitory surface signaling molecules, so-called checkpoints. Several different immune checkpoint molecules have been identified, in particular, cytotoxic T-lymphocyte antigen 4 (CTLA-4) and programmed cell death protein 1 (PD-1) and its ligand 1 (PD-L1). Selectively blocking the interaction of ligands with these checkpoints can lead to amplification of T cell–mediated immunity and disruption of tumor immune escape. Substantial clinical studies have demonstrated that antibodies against CTLA-4 and PD-1/PD-L1 can yield a significant survival improvement in several tumor types, including metastatic melanoma, non-small cell lung cancer, and renal cell carcinoma [25]. However, the routine application of these novel ICI drugs highlights the essence of knowledge and management of ICI-induced immune-related adverse events (irAEs).
In light of the fact that ICI delivers positive antitumor efficacy by interfering with immune system regulation, an activated immune response might attack normal body tissues and be responsible for the development of irAEs. The common irAEs include colitis, hepatitis, pneumonitis, nephritis, and endocrinopathies [6,7]. Although the majority of irAEs show moderate toxicity, there have been reports of ICI- induced deaths, mainly due to autoimmune colitis, myocarditis, and myasthenia gravis [2,811]. Most of mild-to-moderate irAEs can be well controlled by observation and supportive treatment without withholding ICI drugs, however, patients with severe irAEs still require enhanced and timely medical interventions, such as corticosteroids and immunosuppressive agents, in line with the guidelines of the National Comprehensive Cancer Network (NCCN) and European Society for Medical Oncology (ESMO) [12,13]. Our previous study revealed that the toxicity profile and incidence of irAEs varied among ICI drugs [14]. However, the pattern of the time to onset and resolution of ICI-induced irAEs remains undetermined and is worth further exploration. There are few studies concerning the pattern of irAE development in cancer. Martins et al. [15] proposed that the majority of grade ≥ 3 irAEs induced by anti–CTLA-4 antibodies occur within 8–12 weeks of commencing treatment. Skin rash usually had the earliest onset and irAEs tended to occur earlier in the course of nivolumab (NIV) plus ipilimumab (IPI) treatment than in that of IPI monotherapy [15]. Nonetheless, the results were summarized through a literature review rather than statistical calculations and the time to resolution was not investigated. Although Weber et al. [16] demonstrated a characteristic pattern of the occurrence of irAEs, these results were generated based on small sample size (n=325) and the pattern was applicable to only four organ-specific irAEs and specific treatment of IPI 10 mg/kg every 3 weeks, failing to provide a comprehensive view of ICI-induced irAEs in pan-cancers [16].
By using the data derived from robust clinical trials, we conducted a pooled analysis to investigate the pattern of the time to onset, resolution, and immune-modulation resolution of irAEs in cancer, intending to aid a better understanding, timely detection, and effective management of ICI-induced irAEs in routine practice.

Materials and Methods

A prospective protocol was created and uploaded to the PROSPERO online platform, with the registration number CRD42020167835.

1. Data sources and searches

We searched for relevant studies published between January 2007 and December 2019 through public electronic databases, including PubMed, Embase, Cochrane Library, and Web of Science. Two investigators (S.Q.T. and C.X.) determined the final search strategy (Supplementary Materials). After screening the titles or abstracts, full texts were assessed, and references of relevant publications were manually searched.

2. Study selection

We included phase II–III clinical trials that reported the median time to onset, resolution, or immune-modulation resolution of irAEs in cancer receiving ICI-based treatments (e.g., ICI alone or ICI plus conventional therapy). Conventional therapies (CT) included chemotherapy, radiotherapy, and so on. The definitions for outcomes above were listed in Supplementary Materials and were consistent among all included clinical trials. We excluded conference abstracts and presentations of ongoing clinical trials due to the insufficient information.

3. Data extraction and processing

We extracted the data from the main text and supplementary materials. Two reviewers (S.Q.T. and C.X.) independently recorded the data on a predesigned list (Supplementary Materials). Data from the updated study were used to supplement those from the previous report of the same trial. Common Terminology Criteria for Adverse Events were used to evaluate the adverse events and grade the severity of each irAE [17]. Grade ≥ 3 irAEs were considered severe events.

4. Quality assessment

Two reviewers (S.Q.T. and C.X.) used the tool recommended by the Cochrane Collaboration Handbook and the modified Jadad scale to evaluate the quality of the included clinical trials [18,19]. Discrepancies regarding study selection, data extraction, and quality assessment between two reviewers were resolved by discussion.

5. Data synthesis and statistical analysis

The timing data that represented different event subsets to the same organ-specific irAEs were pooled as the timing data of that category. For example, the time to onset of hyperthyroidism and hypothyroidism would be pooled as that of endocrine events. The data with censored values were excluded. We used the pooled median time (weighted median time) to onset (PMT-O), resolution (PMT-R), and immune-modulation resolution (PMT-IMR) and their 95% confidence interval as summary statistics. The outcomes were generated by using the metamedian package in R ver. 3.6.1 (http://www.r-project.org/) [20]. The primary outcomes were PMT-O and PMT-R of all-grade irAEs. The secondary outcomes were PMT-IMR of all-grade irAEs and the outcomes of grade ≥ 3 irAEs. All outcomes were assessed from two different perspectives: overview and detail, based on the time of development of all irAEs and that of organ-specific irAE, respectively.
Given that the different toxicity profiles among ICI agents, the PMT-O, PMT-R, and PMT-IMR were compared between PD-1/PD-L1 inhibitor, CTLA-4 inhibitor, and combination therapy (i.e. more than one kind of ICI agent). The former two treatments refer to applying one ICI agent with or without CT. Subgroup analyses were based on ICI drugs, ICI doses, and cancer types.
Data visualization methods were used to depict the pooled median time and 95% confidence interval via Microsoft Excel (Microsoft, Inc., Redmond, WA). We used the Z test to identify the differences among PMT-O, PMT-R, and PMT-IMR by SPSS ver. 24.0 (IBM Corp., Armonk, NY). All p-values were two-sided with significance defined as p < 0.05.

Results

1. Literature search and characteristics

We included 22 studies involving 23 clinical trials and 8,436 patients in this study (S1 Table, S2 Fig.) [3,2141]. The baseline characteristics of each study were shown in Table 1. Thirteen clinical trials (56.5%) were phase III trials. One study reported the pooled results of a phase I and a phase II clinical trial with a large sample size of 1,738 patients; thus, the phase I trial was also included [32]. The cancer types included lung cancer (number of the involving trials=6), melanoma (n=7), urinary system cancer (n=4), and other (n=6). PD-1/PD-L1 blockade-based treatments included monotherapy of NIV (n=10), pembrolizumab (n=2), and avelumab (n=2). CTLA-4 blockade-based treatments included IPI monotherapy (n=5) and IPI+CT (n=3). Combination therapy included NIV+IPI (n=5). Subgroup analysis included two updated clinical trials without duplicate counting of their sample sizes [30]. According to modified Jadad scores, 20 studies were assessed as high quality, and two studies were assessed as relatively low quality (S3 Table) [3,23].

2. Pooled analysis of the time to onset

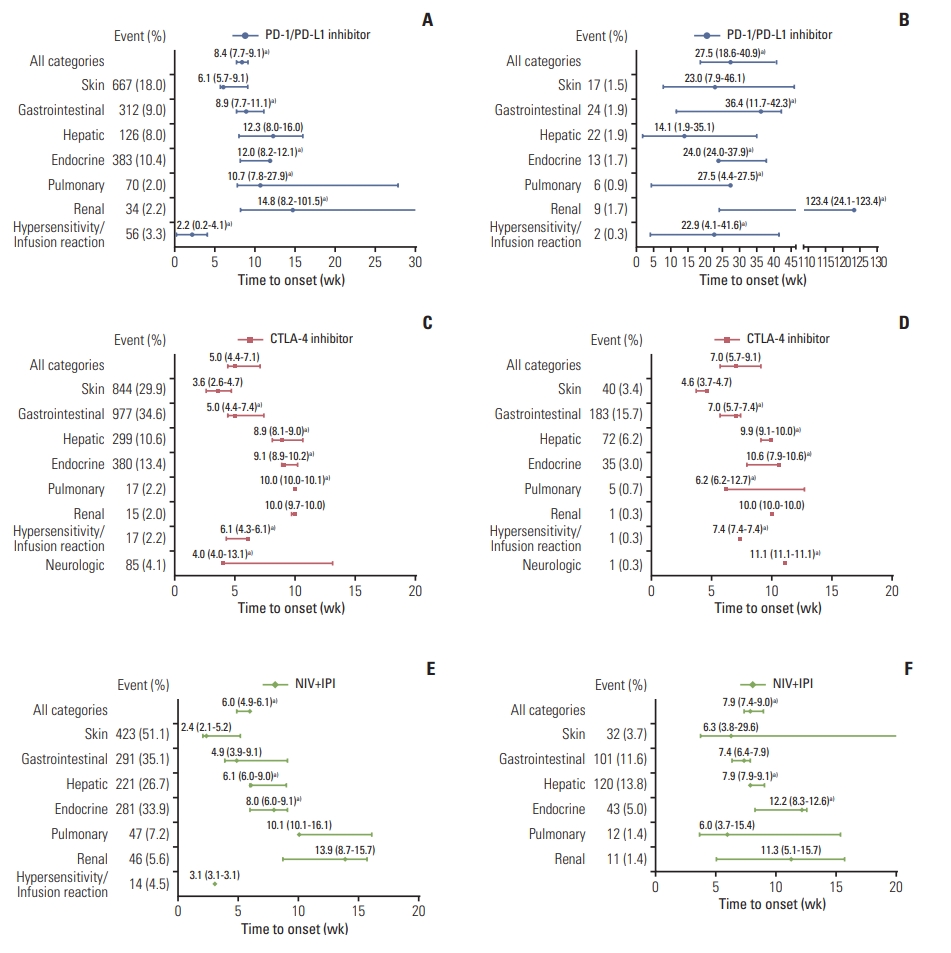
The PMT-O of all-grade irAEs ranged from 2.2 to 14.8 weeks. The four irAEs with the top shortest PMT-O were skin, hypersensitivity/infusion reaction, gastrointestinal, and neurologic events, while the longest PMT-O was observed in renal events (Fig. 1A, C, and E).
The PMT-O of grade ≥ 3 irAEs ranged from 4.6 to 12.2 weeks for CTLA-4 inhibitors and NIV+IPI treatment and ranged from 14.1 to 123.4 weeks for PD-1/PD-L1 inhibitors. Compared with all-grade irAEs, the PMT-O of grade ≥ 3 irAEs was significantly longer for PD-1/PD-L1 inhibitors (27.5 weeks vs. 8.4 weeks, p < 0.001) and NIV+IPI treatment (7.9 weeks vs. 6.0 weeks, p < 0.001) in overview; as for CTLA-4 inhibitors, that was significantly longer in gastrointestinal (7.0 weeks vs. 5.0 weeks, p=0.023), hepatic (9.9 weeks vs. 8.9 weeks, p=0.002), endocrine (10.6 weeks vs. 9.1 weeks, p=0.049), hypersensitivity/infusion reaction (7.4 weeks vs. 6.1 weeks, p=0.005), and neurologic events (11.1 weeks vs. 4.0 weeks, p=0.002) (Fig. 1).

3. Pooled analysis of the time to resolution

The PMT-R of all-grade irAEs ranged from 0.1 to 54.3 weeks. The five irAEs with the top shortest PMT-R were hypersensitivity/infusion reaction, gastrointestinal, pulmonary, hepatic, and renal events, which might be resolved within 10.5 weeks (Fig. 2A, E, and I). The PMT-R of grade ≥ 3 irAEs was within 7.9 weeks when excluding endocrine events (Fig. 2B, F, and J).
In overview, the PMT-R was comparable between grade ≥ 3 and all-grade irAEs. By organ, the PMT-R of grade ≥ 3 irAEs was significantly shorter than that of all-grade irAEs induced by NIV+IPI treatment in skin (3.1 weeks vs. 10.9 weeks, p=0.049), endocrine (11.6 weeks vs. 27.6 weeks, p < 0.001), pulmonary (1.5 weeks vs. 4.5 weeks, p=0.010), and renal events (2.4 weeks vs. 6.3 weeks, p=0.028) (Fig. 2A, B, E, F, I, J). When applying the immune-modulation drug, the time to resolution of grade ≥ 3 irAEs was significantly shorter than that of all-grade irAEs caused by PD-1/PD-L1 blockade (6.9 weeks vs. 40.6 weeks, p=0.002) and NIV+IPI treatment (3.1 weeks vs. 5.9 weeks, p=0.031) in the overview. As for CTLA-4 blockade, the PMT-IMR of grade ≥ 3 irAEs was significantly shorter than that of all-grade irAEs in skin (8.5 weeks vs. 14.4 weeks, p < 0.001), gastrointestinal (3.3 weeks vs. 4.4 weeks, p < 0.001), and hypersensitivity/infusion reaction (0.3 weeks vs. 2.1 weeks, p < 0.001) (Fig. 2C, D, G, H, K, and L).
When compared with PMT-R, the PMT-IMR of all-grade irAEs caused by PD-1/PD-L1 inhibitors was significantly longer (40.6 weeks vs. 10.1 weeks, p=0.010) in overview; as for CTLA-4 inhibitors, the PMT-IMR was significantly longer in skin (14.4 weeks vs. 9.3 weeks, p=0.004), gastrointestinal (4.4 weeks vs. 2.9 weeks, p < 0.001), and hypersensitivity/infusion reaction (2.1 weeks vs. 0.1 weeks, p < 0.001) (Fig. 2A, C, E, G, I, and K). Regardless of grading, hypersensitivity/infusion reaction and endocrine events were associated with the shortest and longest PMT-IMR, respectively, which were similar to the patterns of PMT-R.

4. Subgroup analysis based on ICI drugs

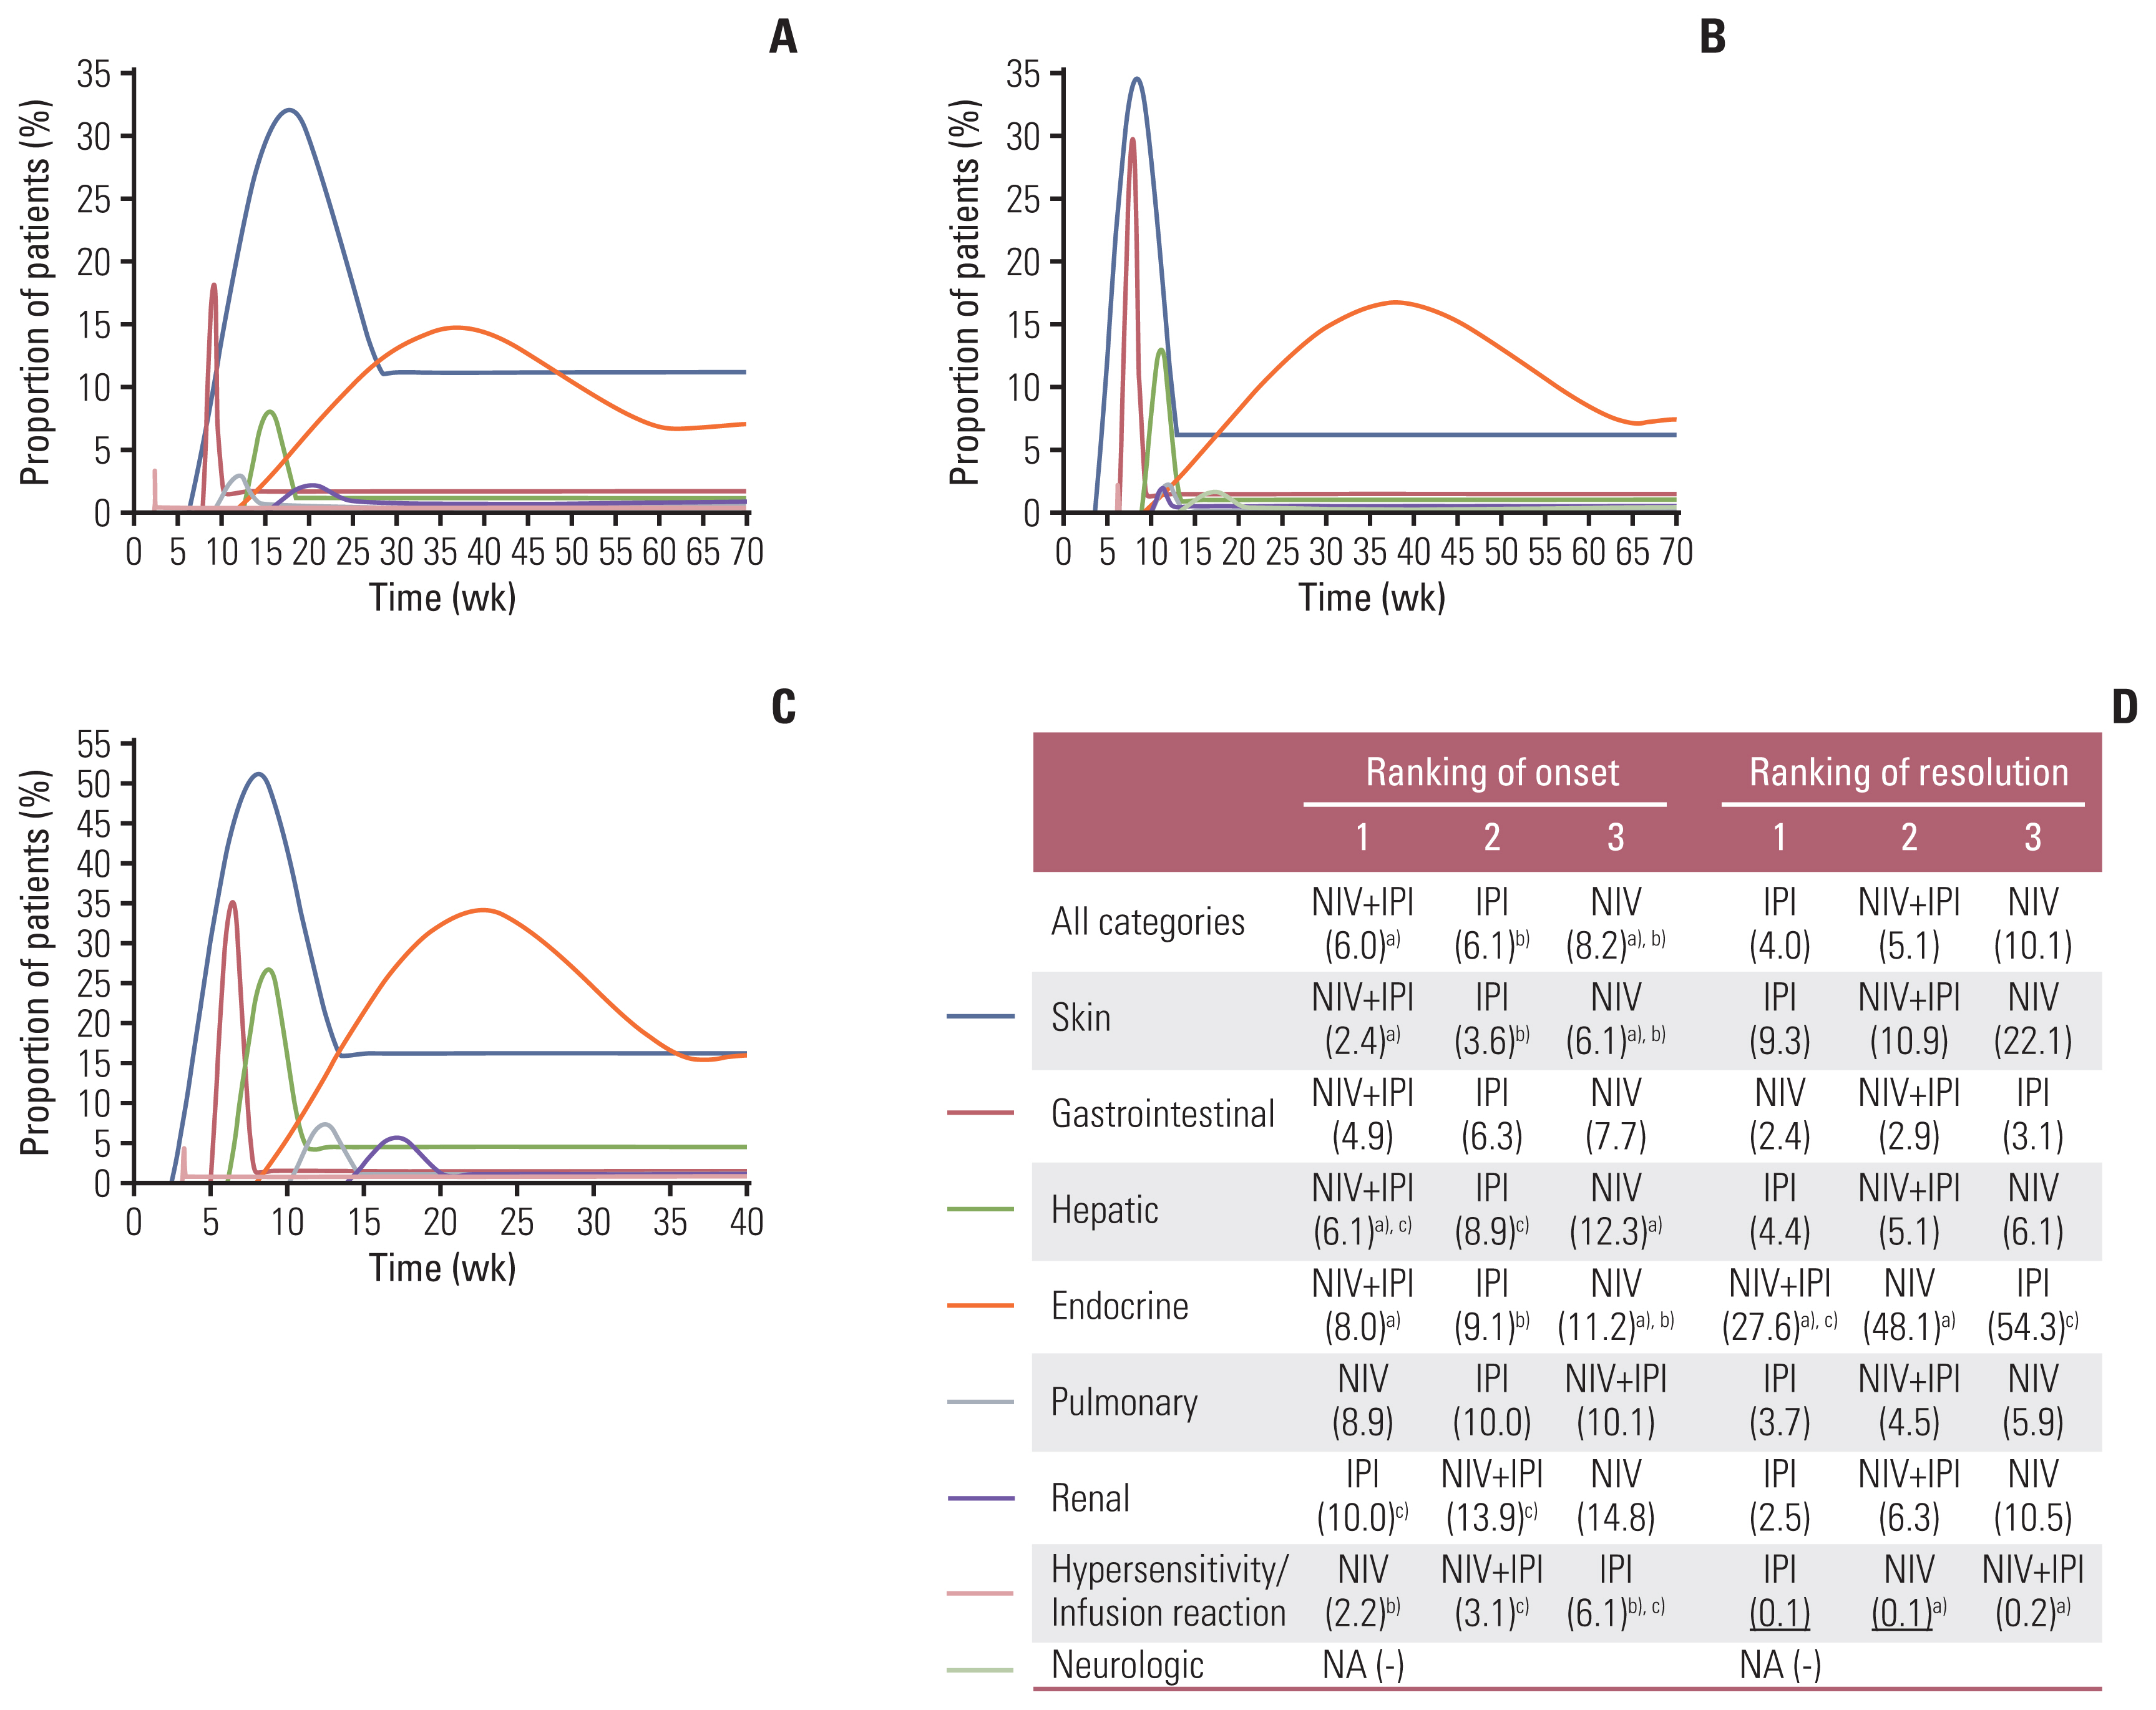
NIV monotherapy was associated with significantly longer PMT-O of all-grade irAEs than NIV+IPI (8.2 weeks vs. 6.0 weeks, p < 0.001) and IPI alone (8.2 weeks vs. 6.1 weeks, p=0.012). The PMT-R was comparable between NIV+IPI and the corresponding monotherapy (Fig. 3).
In terms of grade ≥ 3 irAEs, NIV monotherapy had the significantly longest PMT-O among these three treatments in overview (IPI vs. NIV+IPI vs. NIV: 7.4 weeks vs. 7.9 vs. 27.5 weeks; p < 0.05), especially in gastrointestinal (7.0 weeks vs. 7.4 weeks vs. 36.4 weeks, p < 0.001), endocrine (10.6 weeks vs. 12.2 weeks vs. 24.0 weeks, p < 0.05), pulmonary (6.2 weeks vs. 6.0 weeks vs. 27.5 weeks, p < 0.05), and renal events (10.0 weeks vs. 11.3 weeks vs. 123.4 weeks, p < 0.001) (S4 Table).
In overview, the PMT-O and PMT-R were comparable between IPI alone and IPI+CT. By organ, the PMT-O of hepa-tic (8.9 weeks vs. 5.9 weeks, p < 0.001) and neurologic events (13.1 weeks vs. 4.0 weeks, p < 0.001) and the PMT-R of skin (9.3 weeks vs. 4.3 weeks, p=0.037) and endocrine events (54.3 weeks vs. 10.4 weeks, p < 0.001) were significantly longer in IPI cohort than in IPI+CT cohort (S5 Fig.).

5. Subgroup analysis based on ICI dose

The PMT-O and PMT-R were similar between the two different doses of IPI, except for those of endocrine events and PMT-O of neurologic events. Compared with NIV 1 mg/kg every 3 weeks and IPI 3 mg/kg every 3 weeks, significantly longer PMT-O of skin (5.1 weeks vs. 2.1 weeks, p < 0.001), hepatic (9.0 weeks vs. 6.0 weeks, p < 0.001), pulmonary (15.4 weeks vs. 10.1 weeks, p < 0.001), and renal events (15.7 weeks vs. 13.9 weeks, p=0.002) were observed in the treatment of NIV 3 mg/kg every 3 weeks and IPI 1 mg/kg every 3 weeks; the PMT-R was comparable between two doses of combination therapy in all events except for the gastrointestinal irAE (Table 2).

6. Subgroup analysis based on cancer type

The PMT-O of all-grade irAEs was significantly shorter in lung cancer cohort than in melanoma cohort (4.7 weeks vs. 6.1 weeks, p=0.017), including renal (8.2 weeks vs. 13.9 weeks, p=0.048), hypersensitivity/infusion reaction (0.2 weeks vs. 3.3 weeks, p=0.004), and neurologic (4.0 weeks vs. 13.1 weeks, p < 0.001) events (Table 3). Under the treatment of NIV 3 mg/kg every 2 weeks, two groups showed significantly different PMT-O of hepatic (lung cancer vs. melanoma: 8.0 weeks vs. 14.1 weeks, p < 0.001), hypersensitivity/infusion reaction (0.2 weeks vs. 3.3 weeks, p < 0.001), endocrine (11.2 weeks vs. 8.2 weeks, p=0.007), and pulmonary events (27.9 weeks vs. 8.7 weeks, p=0.001). The PMT-R of organ-specific irAEs were comparable between the two cancer types, except for that of skin events (S6 Table).

Discussion

Currently, ICI is considered to be a promising treatment option for patients with cancer. However, the adverse events associated with immunologic etiology cannot be ignored. Although substantial evidence has demonstrated the safety profile of ICIs, most studies have focused on the incidence and certain kinds of ICI drugs, and the typical timing of the development of irAEs remains unclear [4246]. In this study, we aim to clarify the pattern of time to onset and resolution of ICI-induced irAEs in pan-cancers; therefore, it can provide clues for early recognition and timely management of irAEs to clinicians.
The premise of the successful management of irAEs and the reduction of sequelae is mastering the general pattern. In the previous studies of patients with melanoma receiving ICI monotherapy, it was reported that skin-related irAE was the earliest event to appear (median, 2–6 weeks), followed by gastrointestinal events (6–7 weeks), while renal events were the last to appear (15 weeks). Moreover, endocrine irAEs was the last (28 weeks) event to be resolved [3,16]. The pattern reported in our study was consistent with the above findings. Apart from the commonly selected irAEs in previous studies, we also included hypersensitivity/infusion reaction and neurological events in the analysis, and the former was newly found to be the first to resolve.
Severe irAEs were prone to occur later and be resolved with immune-modulation agents earlier than mild-to-moderate irAEs. On the one hand, this result may be due to the dose-dependent effect of irAEs. In a phase II trial comparing three dose administration of IPI (0.3 mg/kg, 3.0 mg/kg, and 10 mg/kg) in patients with advanced melanoma, the incidence of irAEs was 26%, 56%, and 70% and occurrence of grade 3–4 irAEs was 0%, 7%, and 25% of patients, respectively [47]. Similarly, a dose-based network meta-analysis suggested that high-dose IPI had a greater incidence of 3–4 grade irAEs than low-dose IPI [14]. Besides, in a phase I trial assessing the safety of anti–PD-1 antibody in patients with multiple cancer, an increase in the frequency of grade 3–4 irAE (0%, 4%, and 8%) was observed with an increasing dose level (0.3 mg/kg, 3.0 mg/kg, and 10 mg/kg, respectively) [48]. ICI drugs reach a higher cumulative dose in the later treatment course, therefore inducing late-onset severe irAEs. On the other hand, positive clinical management might foster the earlier resolution of severe irAEs. According to the NCCN and ESMO clinical practice guidelines for the management of immunotherapy-related toxicities, the common management would be observation and supportive treatment when initially encountered with grade 1–2 irAEs [12,13]. However, enhanced medical interventions and close nursing care will be adopted on the condition of dealing with severe irAEs. Given that ICI is a novel therapy with high hopes in the current spotlight, clinicians are more likely to find severe irAEs and perform timely resolutions.
The endocrine-related irAEs featured delayed onset (8.0–12.0 weeks), the longest resolution duration, and the lowest resolution rate in all ICI regimens. This result corroborates those from a study investigating IPI, where it took 9 weeks before the onset of endocrine events [16]. The underlying reason for the long time to recover from endocrine-related irAE was that it might take time for patients to become adequately replaced with the exogenous hormone. Thus, closer follow-up is needed approximately 9 weeks after the start of treatment, and patients should be provided with appropriate education regarding this prolonged treatment, including guidelines for psychological construction, medication norms, regular follow-up time, and adjustment of drug dose.
The irAEs caused by NIV+IPI generally occurred earlier than those induced by NIV alone. In a review, irAEs tended to occur earlier in the course of treatment with IPI plus an anti–PD-1 antibody compared with IPI monotherapy or anti–PD-1/(PD-L1) antibodies [15]. Similarly, a study of 1,551 patients assessed by the European Medicines Agency demonstrated that most of the irAEs occurred earlier in the NIV+IPI cohort than in the monotherapy cohort, including skin, gastrointestinal, hepatic, endocrine and renal events [49].
Although irAEs generally occurred within 14.8 weeks after the first dose of ICI drugs, they could appear several months even years after the completion of treatment. In this study, we noticed that the maximum time to onset could reach three years after starting treatment in some cases. The wide range in time of onset was also described in recent publications. The cutaneous presentation occurred in patients up to 60 weeks after the first dose of anti–PD-1 treatment in stage IV melanoma [50]. Ocular adverse effects were experienced by some patients with metastatic melanoma 1 year after the last dose of IPI [51]. Although the half-life of ICI is ascertained, such as two weeks for IPI, it may still have a biological effect for a long time after the drug is cleared [13,52]. Thus, surveillance should be reinforced and a long-term multidisciplinary follow-up should be arranged.
Several limitations should be mentioned. First, irAEs were diagnosed by investigators, which might be influenced by clinical experience. Indeed, the incidence of irAEs reported by randomized controlled trials published after 2017 seemed greater than those before (76.9% vs. 58.5%). It may be because more attention has been paid to these adverse events and more clinical experience has been gained. Hence, the quantifiable criteria to clarify the definition of irAE are eagerly awaited. Second, standard deviations or quartile information of timing data were not extracted and analyzed because they were rarely reported. Nevertheless, to make a reliable estimation, the metamedian method used in this study was proved to be well-performed under this circumstance by collecting median values [20]. Third, the dataset of the group receiving anti–PD-1/PD-L1 treatment mainly originated from the trials on NIV. Thus, the applicability of corresponding results may be more specific to NIV monotherapy and the clinical trials involving ICI agents are recommended to report the time data on the development of irAEs in the future. Fourth, the subgroup analysis of cancer types involved a small number of trials, so the relevant results should be regarded with caution.
The irAEs induced by ICI agents appear to be an emerging challenge in clinical practice. This study revealed the occurrence pattern of irAEs, expanding the knowledge of the characteristics of this new issue. Our findings may serve as a useful tool to help clinicians detect irAEs timely and make therapeutic decisions properly.

Notes

Author Contributions

Conceived and designed the analysis: Tang SQ, Tang LL, Mao YP, Xu C, Ma J.

Collected the data: Tang SQ, Tang LL, Mao YP, Li WF, Chen L, Zhang Y, Guo Y.

Contributed data or analysis tools: Tang SQ, Tang LL, Mao YP, Li WF, Chen L.

Performed the analysis: Tang SQ, Tang LL, Mao YP, Zhang Y, Guo Y, Liu Q.

Wrote the paper: Tang SQ, Tang LL, Mao YP.

Review: Sun Y, Xu C, Ma J.

Conflicts of Interest

Conflict of interest relevant to this article was not reported.

Acknowledgments

This study was supported by the National Natural Science Foundation of China (81930072), Key-Area Research and Development Program of Guangdong Province (2019B020230002), Natural Science Foundation of Guangdong Province (2017A030312003), Health & Medical Collaborative Innovation Project of Guangzhou City, China (201803040003), Innovation Team Development Plan of the Ministry of Education (No. IRT_17R110), and Overseas Expertise Introduction Project for Discipline Innovation (111 Project, B14035).

Fig. 1
The pattern of time to onset of all-grade (A, C, E) and grade ≥ 3 (B, D, F) irAEs. Circles and bars represent median values and 95% confidence intervals, respectively. Number and percent of an event indicate the incidence of the irAE. CTLA-4, cytotoxic T-lymphocyte antigen 4; IPI, ipilimumab; irAEs, immune-related adverse events; NIV, nivolumab; PD-1/PD-L1, programmed cell death protein 1 or its ligand 1. a)p < 0.05 between the comparison of time to onset of all-grade irAEs and grade ≥ 3 irAEs. A total of 3,977 and 1,261 patients were included in the analysis of all-grade and grade ≥ 3 irAEs, respectively, for PD-1/PD-L1 inhibitors; 2,958 and 1,294 patients for CTLA-4 inhibitors; 828 and 867 patients for NIV+IPI.
crt-2020-790f1.jpg
Fig. 2
The pattern of resolution (A, B, E, F, I, J) and immune-modulation resolution (C, D, G, H, K, L) of all-grade (A, E, I, C, G, K) and grade ≥ 3 (B, F, J, D, H, L) irAEs. Circles and bars represent median values and 95% confidence intervals, respectively. Number and percent of an event indicate the patients whose irAE resolved (A, B, E, F, I, J) and patients whose irAE resolved with usage of immune-modulation agents (C, D, G, H, K, L). CTLA-4, cytotoxic T-lymphocyte antigen 4; IM, immune-modulation; IPI, ipilimumab; irAEs, immune-related adverse events; NIV, nivolumab; PD-1/PD-L1, programmed cell death protein 1 or its ligand 1. a)p < 0.05 between the comparison of time to resolution of all-grade and grade ≥ 3 irAEs, b)p < 0.05 between the comparison of time to immune-modulation resolution of all-grade and grade ≥ 3 irAEs, c)p < 0.05 between the comparison of time to resolution and immune-modulation resolution of all-grade, d)p < 0.05 between the comparison of time to resolution and immune-modulation resolution of grade ≥ 3 irAEs. A total of 1,196 and 192 patients were included in the analysis of time to resolution and immune-modulation resolution of all-grade irAEs, respectively, for PD-1/PD-L1 inhibitors; 2,611 and 402 patients for CTLA-4 inhibitors; 1,572 and 247 patients for NIV+IPI. A total of 71 and 37 patients were included in the analysis of time to resolution and immune-modulation resolution of grade ≥ 3 irAEs, respectively, for PD-1/PD-L1 inhibitors; 348 and 194 patients for CTLA-4 inhibitors; 254 and 117 patients for NIV+IPI.
crt-2020-790f2.jpg
Fig. 3
Kinetics (A–C) and ranking (D) of the onset and resolution of all-grade irAEs caused by nivolumab (A), IPI (B), and nivolumab plus IPI (C). The beginning and end of each curve in Fig. 3A–C represent the median time to the onset of an irAE and the median time to resolution, respectively; the peak and tail of each curve show the proportion of patients who developed an irAE and the proportion of patients whose irAE had not been resolved, respectively. The number in parentheses of Fig. 3D represents the pooled median time (weeks). The ranking is arranged from the shortest to the longest pooled median time. Items with underlining share the same ranking. IPI, ipilimumab; irAEs, immune-related adverse events; NA, not applicable; NIV, nivolumab. a)p < 0.05 between the comparison of NIV and NIV+IPI, b)p < 0.05 between the comparison of NIV and IPI, c)p < 0.05 between the comparison of IPI and NIV+IPI. A total of 1,815 and 1,196 patients were included in the analysis of time to onset and resolution, respectively, for NIV; 2,092 and 2,123 patients for IPI; 828 and 1,572 patients for NIV+IPI.
crt-2020-790f3.jpg
Table 1
Baseline characteristics of the included studies
Author, year Study ID Region Cancer Phase Total No. Safety analysis No. Arm Treatment Median follow-up time (mo) CTCAE version
Weber (2013) [21] MDX010-20 MN Melanoma III 676 403 1 IPI 3 mg/kg Q3W plus gp100 21.0 3.0
131 2 IPI 3 mg/kg Q3W 27.8
136 3 Gp 100 17.2
Kwon (2014) [22] CA184-043 MN Prostate cancer III 799 399 1 IPI 10 mg/kg Q3W plus bone-directed radiotherapy 9.9 3.0
400 2 Placebo plus bone-directed radiotherapy 9.3
Brahmer (2015) [3] CheckMate 017 MN Lung cancer III 272 131 1 NIV 3 mg/kg Q2W Min 11.0 4.0
129 2 DOC 75 mg/m2 Q3W Min 11.0
Borghaei (2015) [23] CheckMate 057 MN Lung cancer III 582 287 1 NIV 3 mg/kg Q2W Min 13.2 4.0
268 2 DOC 75 mg/m2 Q3W Min 13.2
Reck (2016) [25] CA184-156 MN Lung cancer III 954 478 1 IPI 10 mg/kg Q3W, ETO, and DDP or CBP 10.5 3.0
476 2 ETO and DDP or CBP 10.2
Eggermont (2016) [24] EORTC 18071 MN Melanoma III 951 471 1 IPI 10 mg/kg Q3W 63.6 3.0
476 2 Placebo Q3W 64.8
Weber (2017) [27] CheckMate 238 MN Melanoma III 905 452 1 NIV 3 mg/kg Q2W 19.5 4.0
453 2 IPI 10 mg/kg Q3W 19.5
Ascierto (2017) [26] CA184-169 MN Melanoma III 727 364 1 IPI 10 mg/kg Q3W 14.5 3.0
362 2 IPI 3 mg/kg Q3W 11.2
Larkin (2017) [28] CheckMate 037 MN Melanoma II 405 268 1 NIV 3 mg/kg Q2W 24.0 4.0
102 2 ICC (DTIC 1,000 mg/m2 Q3W or CBP AUC=6 and PTX 175 mg/m2 Q3W) 24.0
Govindan (2017) [29] CA184-104 MN Lung cancer III 749 388 1 IPI 10 mg/kg Q3W, PTX and CBP 12.5 3.0
361 2 PTX and CBP 11.8
Horn (2017) [30] CheckMate 017 MN Lung cancer III 854 418 1 NIV 3 mg/kg Q2W Min 24.0 4.0
CheckMate 057 MN Lung cancer III 397 2 DOC 75 mg/m2 Q3W Min 24.0
Armand (2018) [31] CheckMate 205 MN Hodgkin lymphoma II 243 243 1 NIV 3 mg/kg Q2W 18.0 4.0
Kelly (2018) [32] JAVELIN Solid Tumor MN Solid tumors Ia) 1,650 1,650 1 AVE 10 mg/kg Q2W Min 3.0 4.0
JAVELIN Merkel 200 MN Merkel cell carcinoma II 88 88 1 AVE 10 mg/kg Q2W Min 9.0 4.0
Larkin (2019) [34] CheckMate 067 MN Melanoma III 945 313 1 NIV 1 mg/kg plus IPI 3 mg/kg Q3W, followed by NIV 3 mg/kg Q2W Min 60.0 4.0
313 2 NIV 3 mg/kg Q2W 36.9
311 3 IPI 3 mg/kg Q3W 19.9
Geoerger (2019) [35] Keynote 051 MN Advanced pediatric cancer I–II 154 154 1 PEM 2 mg/kg Q3W 8.6 4.0
Fradet (2019) [33] Keynote 045 MN Urothelial carcinoma III 542 270 1 PEM 200 mg Q3W 27.7 4.0
272 2 PTX 175 mg/m2 Q3W, DOC 75 mg/m2 Q3W, or VIN 320 mg/m2 Q3W 27.7
Tomita (2020) [41] CheckMate 214 Japan Renal cell carcinoma III 72 38 1 NIV 3 mg/kg plus IPI 1 mg/kg Q3W, followed by NIV 3 mg/kg Q2W 32.4 4.0
34 2 SUN 50 mg QD for 4 weeks Q6W 32.4
Lebbe (2019) [38] CheckMate 511 MN Melanoma IIIB/IV 358 180 1 NIV 3 mg/kg plus IPI 1 mg/kg Q3W, followed by NIV 480 mg Q4W 18.8 4.0
178 2 NIV 1 mg/kg plus IPI 3 mg/kg Q3W, followed by NIV 480 mg Q4W 18.6
Sharma (2020) [40] CheckMate 032 MN Urothelial carcinoma I/II 274 78 1 NIV 3 mg/kg Q2W Min 37.7 4.0
104 2 NIV 3 mg/kg plus IPI 1 mg/kg Q3W, followed by NIV 3 mg/kg Q2W Min 38.8
92 3 NIV 1 mg/kg plus IPI 3 mg/kg Q3W, followed by NIV 3 mg/kg Q2W Min 7.9
Morse (2019) [39] CheckMate 142 MN Colorectal cancer II 119 119 1 NIV 3 mg/kg plus IPI 1 mg/kg Q3W, followed by NIV 3 mg/kg Q2W 13.4 4.0
Carneiro (2019) [36] NA MN Adrenocortical carcinoma II 10 10 1 NIV 240 mg Q2W 4.5 4.0
Horinouchi (2019) [37] ONO 4538 05 Japan Lung cancer II 35 35 1 NIV 3 mg/kg Q2W 36.0 4.0
ONO 4538 06 Japan Lung cancer II 76 76 1 NIV 3 mg/kg Q2W 36.0 4.0

AUC, area under the curve; AVE, avelumab; CBP, carboplatin; CTCAE, Common Terminology Criteria for Adverse Events; DDP, cisplatin; DOC, docetaxel; DTIC, dacarbazine; ETO, etoposide; ICC, investigator’s choice chemotherapy; IPI, ipilimumab; MN, multinational; NA, not available; NIV, nivolumab; PEM, pembrolizumab; PTX, paclitaxel; Q2W, every 2 weeks; Q3W, every 3 weeks; Q6W, every 6 weeks; SUN, sunitinib; VIN, vinflunine.

a) The study of Kelly et al. [32] reported pooled results of phase I and phase II clinical trials with a large sample size (n=1,738); thus, the phase I trial was also included in the analysis.

Table 2
Time to onset and resolution of all-grade irAEs based on ICI doses
IPI-3 IPI-10 NIV-1+IPI-3 NIV-3+IPI-1
All categories
 No. of patients with irAE 606 (13.5) 1,565 (20.3) 921 (29.9) 402 (19.9)
  Time to onset (wk) 5.1 (3.6–7.1) 6.3 (4.1–8.9) 4.9 (2.4–6.1) 6.1 (5.2–9.0)
 No. of patients with irAE 495 (87.3) 1,252 (85.2) 663 (79.0) 607 (82.8)
  Time to resolution (wk) 3.6 (2.9–11.0) 4.4 (3.1–7.0) 5.1 (2.9–10.9) 5.0 (1.8–6.3)
Skin
 No. of patients with irAE 218 (32.4) 460 (35.7) 288 (58.7) 135 (40.1)
  Time to onset (wk) 3.6 (3.6–5.1) 2.6 (2.6–4.1) 2.1 (2.1–2.4)a) 5.1 (3.1–5.2)a)
 No. of patients with resolution 179 (82.1) 377 (82.0) 193 (67.2) 100 (70.9)
  Time to resolution (wk) 11 (5.1–11.0) 9.3 (3.1–9.3) 10.9 (10.9–24.1) 9.0 (9.0–13.1)
Gastrointestinal
 No. of patients with irAE 231 (34.3) 567 (44.0) 207 (42.2) 84 (24.9)
  Time to onset (wk) 7.1 (4.6–7.6) 6.3 (4.4–7.6) 4.9 (3.9–4.9) 6.1 (3.6–9.1)
 No. of patients with resolution 218 (94.8) 539 (95.1) 197 (95.6) 170 (96.6)
  Time to resolution (wk) 2.9 (2.9–3.6) 3.1 (2.1–4.0) 2.9 (2.9–3.0)a) 1.5 (1.5–2.7)a)
Hepatic
 No. of patients with irAE 32 (4.8) 223 (17.3) 163 (33.2) 58 (17.2)
  Time to onset (wk) 8.9 (6.1–9.0) 8.9 (8.1–8.9) 6.0 (6.0–6.1)a) 9.0 (7.0–10.0)a)
 No. of patients with resolution 30 (93.8) 205 (91.9) 148 (90.8) 117 (76.0)
  Time to resolution (wk) 4.1 (2.9–4.1) 4.4 (4.4–7.0) 5.1 (5.1–6.1) 5.0 (2.0–8.2)
Endocrine
 No. of patients with irAE 57 (8.5) 269 (20.9) 192 (39.1) 89 (26.4)
  Time to onset (wk) 9.1 (8.9–9.1)b) 10.2 (8.9–10.2)b) 8.0 (6.0–8.0) 6.1 (6.1–12.0)
 No. of patients with resolution 14 (70.0) 93 (53.8) 57 (53.3) -
  Time to resolution (wk) 3.4 (3.4–3.4)b) 54.3 (13.9–54.3)b) 27.6 (27.6–27.6) NA
Pulmonary
 No. of patients with irAE 6 (1.9) 11 (2.4) 25 (8.0) 22 (6.5)
  Time to onset (wk) 10.1 (10.1–10.1) 10.0 (10.0–10.0) 10.1 (10.1–10.1)a) 15.4 (10.5–16.6)a)
 No. of patients with resolution 5 (83.3) 11 (100) 29 (96.7) 114 (84.4)
  Time to resolution (wk) 6.3 (6.3–6.3) 3.7 (3.7–3.7) 7.0 (3.0–7.0) 4.5 (2.8–14.6)
Renal
 No. of patients with irAE 8 (2.6) 7 (1.5) 32 (6.5) 14 (4.2)
  Time to onset (wk) 10.0 (10.0–10.0) 9.7 (9.7–9.7) 13.9 (8.7–13.9)a) 15.7 (12.6–36.4)a)
 No. of patients with resolution 7 (87.5) 4 (57.1) 27 (84.4) 106 (83.5)
  Time to resolution (wk) 2.5 (2.5–2.5) 52.7 (52.7–52.7) 2.1 (1.3–2.1) 6.3 (1.6–6.9)
Hypersensitivity/Infusion reaction
 No. of patients with irAE 8 (2.6) 9 (2.0) 14 (4.5) -
  Time to onset (wk) 4.3 (4.3–4.3) 6.1 (6.1–6.1) 3.1 (3.1–3.1) NA
 No. of patients with resolution 8 (100) 9 (100) 12 (85.7) -
  Time to resolution (wk) 0.1 (0.1–0.1) 0.1 (0.1–0.1) 0.2 (0.2–0.2) NA
Neurologic
 No. of patients with irAE 1 (0.3) 19 (2.3) - -
  Time to onset (wk) 11.7 (11.7–11.7)b) 13.1 (10.4–13.1)b) NA NA
 No. of patients with resolution 1 (100) 14 (73.7) - -
  Time to resolution (wk) 0.7 (0.7–0.7) 8.0 (8.0–11.6) NA NA

Values are presented as number (%) or median (95% confidence interval). ICI, immune checkpoint inhibitor; IPI-1, ipilimumab 1 mg/kg Q3W; IPI-3, ipilimumab 3 mg/kg Q3W; IPI-10, ipilimumab 10 mg/kg Q3W; irAE, immune-related adverse event; NA, not available; NIV-1, nivolumab 1 mg/kg Q3W; NIV-3, nivolumab 3 mg/kg Q3W.

a) p < 0.05 between the comparison of NIV1+IPI3 and NIV3+IPI1,

b) p < 0.05 between the comparison of IPI3 and IPI10.

Table 3
Time to onset and resolution of all-grade immune-related adverse events based on cancer types
Lung cancer Melanoma
All categories
 No. of patients with irAE 800 (10.0) 4,359 (18.3)
  Time to onset (wk) 4.7 (4.7–5.7)a) 6.1 (5.7–7.6)a)
 No. of patients with irAE 502 (76.9) 3,222 (80.5)
  Time to resolution (wk) 4.0 (2.7–9.4) 4.4 (3.4–6.9)
Skin
 No. of patients with irAE 270 (19.4) 1,496 (40.8)
  Time to onset (wk) 4.7 (2.9–5.7) 4.0 (2.6–5.7)
 No. of patients with resolution 178 (76.7) 1,026 (72.6)
  Time to resolution (wk) 9.4 (4.3–10.1) 10.9 (5.1–22.1)
Gastrointestinal
 No. of patients with irAE 226 (16.2) 1,294 (35.3)
  Time to onset (wk) 4.5 (4.4–22.4) 6.3 (4.6–7.6)
 No. of patients with resolution 186 (86.5) 1,217 (94.3)
  Time to resolution (wk) 2.7 (2.3–2.9) 2.9 (2.4–3.1)
Hepatic
 No. of patients with irAE 74 (5.3) 542 (14.8)
  Time to onset (wk) 8.0 (2.0–9.0) 8.9 (6.1–9.0)
 No. of patients with resolution 56 (83.6) 491 (90.6)
  Time to resolution (wk) 3.3 (2.0–4.0)a) 5.1 (4.4–6.1)a)
Endocrine
 No. of patients with irAE 107 (7.7) 749 (20.4)
  Time to onset (wk) 11.2 (8.9–13.3) 8.9 (8.0–10.2)
 No. of patients with resolution 18 (52.9) 258 (53.6)
  Time to resolution (wk) 10.4 (10.4–10.4) 29.1 (13.9–54.3)
Pulmonary
 No. of patients with irAE 25 (4.7) 77 (3.1)
  Time to onset (wk) 27.9 (4.8–27.9)a) 10.1 (8.7–10.1)a)
 No. of patients with resolution 16 (84.2) 69 (89.6)
  Time to resolution (wk) 5.9 (5.9–5.9) 6.3 (3.0–7.0)
Renal
 No. of patients with irAE 17 (3.2) 70 (2.8)
  Time to onset (wk) 8.2 (8.2–17.8)a) 13.9 (9.7–15.7)a)
 No. of patients with resolution 6 (54.5) 54 (77.1)
  Time to resolution (wk) 10.5 (10.5–10.5)a) 2.3 (2.1–10.5)a)
Hypersensitivity/Infusion reaction
 No. of patients with irAE 16 (3.0) 66 (3.1)
  Time to onset (wk) 0.2 (0.2–1.8)a) 3.3 (2.2–6.1)a)
 No. of patients with resolution 10 (100) 59 (89.4)
  Time to resolution (wk) 0.1 (0.1–0.1) 0.1 (0.1–0.2)
Neurologic
 No. of patients with irAE 65 (7.5) 20 (1.7)
  Time to onset (wk) 4.0 (4.0–7.1)a) 13.1 (10.4–13.1)a)
 No. of patients with resolution 32 (49.2) 15 (75.0)
  Time to resolution (wk) 28.7 (28.7–28.9)a) 8.0 (0.7–11.6)a)

Values are presented as number (%) or median (95% confidence interval). irAE, immune-related adverse event.

a) p < 0.05 between the comparison of lung cancer and melanoma.

References

1. Jain A, Zhang Q, Toh HC. Awakening immunity against cancer: a 2017 primer for clinicians. Chin J Cancer. 2017;36:67.
crossref pmid pmc
2. Hodi FS, O’Day SJ, McDermott DF, Weber RW, Sosman JA, Haanen JB, et al. Improved survival with ipilimumab in patients with metastatic melanoma. N Engl J Med. 2010;363:711–23.
crossref pmid pmc
3. Brahmer J, Reckamp KL, Baas P, Crino L, Eberhardt WE, Poddubskaya E, et al. Nivolumab versus docetaxel in advanced squamous-cell non-small-cell lung cancer. N Engl J Med. 2015;373:123–35.
crossref pmid pmc
4. McDermott DF, Drake CG, Sznol M, Choueiri TK, Powderly JD, Smith DC, et al. Survival, durable response, and long-term safety in patients with previously treated advanced renal cell carcinoma receiving nivolumab. J Clin Oncol. 2015;33:2013–20.
crossref pmid pmc
5. Lim SM, Kim SW, Cho BC, Kang JH, Ahn MJ, Kim DW, et al. Real-world experience of nivolumab in non-small cell lung cancer in Korea. Cancer Res Treat. 2020;52:1112–9.
crossref pmid pmc
6. Weber JS, Hodi FS, Wolchok JD, Topalian SL, Schadendorf D, Larkin J, et al. Safety profile of nivolumab monotherapy: a pooled analysis of patients with advanced melanoma. J Clin Oncol. 2017;35:785–92.
crossref pmid
7. Weber JS, Yang JC, Atkins MB, Disis ML. Toxicities of immunotherapy for the practitioner. J Clin Oncol. 2015;33:2092–9.
crossref pmid pmc
8. Johnson DB, Saranga-Perry V, Lavin PJ, Burnette WB, Clark SW, Uskavitch DR, et al. Myasthenia gravis induced by ipilimumab in patients with metastatic melanoma. J Clin Oncol. 2015;33:e122–4.
crossref pmid pmc
9. Liao B, Shroff S, Kamiya-Matsuoka C, Tummala S. Atypical neurological complications of ipilimumab therapy in patients with metastatic melanoma. Neuro Oncol. 2014;16:589–93.
crossref pmid pmc
10. Moslehi JJ, Salem JE, Sosman JA, Lebrun-Vignes B, Johnson DB. Increased reporting of fatal immune checkpoint inhibitor-associated myocarditis. Lancet. 2018;391:933.
crossref pmc
11. Salem JE, Manouchehri A, Moey M, Lebrun-Vignes B, Bastarache L, Pariente A, et al. Cardiovascular toxicities associated with immune checkpoint inhibitors: an observational, retrospective, pharmacovigilance study. Lancet Oncol. 2018;19:1579–89.
crossref pmid pmc
12. National Comprehensive Cancer NetworkNCCN Clinical Practice Guidelines in Oncology, version 1 [Internet]. Plymouth Meeting, PA: National Comprehensive Cancer Network; 2020. [cited 2020 Aug 8]. Available from: https://www.nccn.org/professionals/physician_gls/default.aspx

13. Haanen J, Carbonnel F, Robert C, Kerr KM, Peters S, Larkin J, et al. Management of toxicities from immunotherapy: ESMO Clinical Practice Guidelines for diagnosis, treatment and follow-up. Ann Oncol. 2017;28:iv119–42.
crossref pmid
14. Xu C, Chen YP, Du XJ, Liu JQ, Huang CL, Chen L, et al. Com- parative safety of immune checkpoint inhibitors in cancer: systematic review and network meta-analysis. BMJ. 2018;363:k4226.
crossref pmid pmc
15. Martins F, Sofiya L, Sykiotis GP, Lamine F, Maillard M, Fraga M, et al. Adverse effects of immune-checkpoint inhibitors: epidemiology, management and surveillance. Nat Rev Clin Oncol. 2019;16:563–80.
crossref pmid
16. Weber JS, Kahler KC, Hauschild A. Management of immune-related adverse events and kinetics of response with ipilimumab. J Clin Oncol. 2012;30:2691–7.
crossref pmid
17. Common Terminology Criteria for Adverse Events version 50 [Internet]. Washington, DC: U.S. Department of Health and Human Services; 2017. [cited 2020 Nov 5]. Available from: https://www.eortc.be/services/doc/ctc/CTCAE_v5_Quick_Reference_5x7.pdf

18. Cumpston M, Li T, Page MJ, Chandler J, Welch VA, Higgins JP, et al. Updated guidance for trusted systematic reviews: a new edition of the Cochrane Handbook for Systematic Reviews of Interventions. Cochrane Database Syst Rev. 2019;10:ED000142.
crossref pmid
19. Jadad AR, Moore RA, Carroll D, Jenkinson C, Reynolds DJ, Gavaghan DJ, et al. Assessing the quality of reports of randomized clinical trials: is blinding necessary? Control Clin Trials. 1996;17:1–12.
crossref pmid
20. McGrath S, Zhao X, Qin ZZ, Steele R, Benedetti A. One-sample aggregate data meta-analysis of medians. Stat Med. 2019;38:969–84.
crossref pmid
21. Weber JS, Dummer R, de Pril V, Lebbe C, Hodi FS; MDX010-20 Investigators. Patterns of onset and resolution of immune-related adverse events of special interest with ipilimumab: detailed safety analysis from a phase 3 trial in patients with advanced melanoma. Cancer. 2013;119:1675–82.
crossref pmid
22. Kwon ED, Drake CG, Scher HI, Fizazi K, Bossi A, van den Eertwegh AJ, et al. Ipilimumab versus placebo after radiotherapy in patients with metastatic castration-resistant prostate cancer that had progressed after docetaxel chemotherapy (CA184-043): a multicentre, randomised, double-blind, phase 3 trial. Lancet Oncol. 2014;15:700–12.
crossref pmid pmc
23. Borghaei H, Paz-Ares L, Horn L, Spigel DR, Steins M, Ready NE, et al. Nivolumab versus docetaxel in advanced nonsquamous non-small-cell lung cancer. N Engl J Med. 2015;373:1627–39.
crossref pmid pmc
24. Eggermont AM, Chiarion-Sileni V, Grob JJ, Dummer R, Wolchok JD, Schmidt H, et al. Prolonged survival in stage III melanoma with ipilimumab adjuvant therapy. N Engl J Med. 2016;375:1845–55.
crossref pmid pmc
25. Reck M, Luft A, Szczesna A, Havel L, Kim SW, Akerley W, et al. Phase III randomized trial of ipilimumab plus etoposide and platinum versus placebo plus etoposide and platinum in extensive-stage small-cell lung cancer. J Clin Oncol. 2016;34:3740–8.
crossref pmid
26. Ascierto PA, Del Vecchio M, Robert C, Mackiewicz A, Chiarion-Sileni V, Arance A, et al. Ipilimumab 10 mg/kg versus ipilimumab 3 mg/kg in patients with unresectable or metastatic melanoma: a randomised, double-blind, multicentre, phase 3 trial. Lancet Oncol. 2017;18:611–22.
crossref pmid
27. Weber J, Mandala M, Del Vecchio M, Gogas HJ, Arance AM, Cowey CL, et al. Adjuvant nivolumab versus ipilimumab in resected stage III or IV melanoma. N Engl J Med. 2017;377:1824–35.
crossref pmid
28. Larkin J, Minor D, D’Angelo S, Neyns B, Smylie M, Miller WH Jr, et al. Overall survival in patients with advanced melanoma who received nivolumab versus investigator’s choice chemotherapy in CheckMate 037: a randomized, controlled, open-label phase III trial. J Clin Oncol. 2018;36:383–90.
crossref pmid
29. Govindan R, Szczesna A, Ahn MJ, Schneider CP, Gonzalez Mella PF, Barlesi F, et al. Phase III trial of ipilimumab combined with paclitaxel and carboplatin in advanced squamous non-small-cell lung cancer. J Clin Oncol. 2017;35:3449–57.
crossref pmid
30. Horn L, Spigel DR, Vokes EE, Holgado E, Ready N, Steins M, et al. Nivolumab versus docetaxel in previously treated patients with advanced non-small-cell lung cancer: two-year outcomes from two randomized, open-label, phase III trials (CheckMate 017 and CheckMate 057). J Clin Oncol. 2017;35:3924–33.
crossref pmid pmc
31. Armand P, Engert A, Younes A, Fanale M, Santoro A, Zinzani PL, et al. Nivolumab for relapsed/refractory classic Hodgkin lymphoma after failure of autologous hematopoietic cell transplantation: extended follow-up of the multicohort single-arm phase II CheckMate 205 trial. J Clin Oncol. 2018;36:1428–39.
crossref pmid pmc
32. Kelly K, Infante JR, Taylor MH, Patel MR, Wong DJ, Iannotti N, et al. Safety profile of avelumab in patients with advanced solid tumors: a pooled analysis of data from the phase 1 JAVELIN solid tumor and phase 2 JAVELIN Merkel 200 clinical trials. Cancer. 2018;124:2010–7.
crossref pmid pmc
33. Fradet Y, Bellmunt J, Vaughn DJ, Lee JL, Fong L, Vogelzang NJ, et al. Randomized phase III KEYNOTE-045 trial of pembrolizumab versus paclitaxel, docetaxel, or vinflunine in recurrent advanced urothelial cancer: results of >2 years of follow-up. Ann Oncol. 2019;30:970–6.
crossref pmid pmc pdf
34. Larkin J, Chiarion-Sileni V, Gonzalez R, Grob JJ, Rutkowski P, Lao CD, et al. Five-year survival with combined nivolumab and ipilimumab in advanced melanoma. N Engl J Med. 2019;381:1535–46.
crossref pmid
35. Geoerger B, Kang HJ, Yalon-Oren M, Marshall LV, Vezina C, Pappo A, et al. Pembrolizumab in paediatric patients with advanced melanoma or a PD-L1-positive, advanced, relapsed, or refractory solid tumour or lymphoma (KEYNOTE-051): interim analysis of an open-label, single-arm, phase 1–2 trial. Lancet Oncol. 2020;21:121–33.
crossref pmid
36. Carneiro BA, Konda B, Costa RB, Costa RL, Sagar V, Gursel DB, et al. Nivolumab in metastatic adrenocortical carcinoma: results of a phase 2 trial. J Clin Endocrinol Metab. 2019;104:6193–200.
crossref pmid
37. Horinouchi H, Nishio M, Hida T, Nakagawa K, Sakai H, Nogami N, et al. Three-year follow-up results from phase II studies of nivolumab in Japanese patients with previously treated advanced non-small cell lung cancer: pooled analysis of ONO-4538-05 and ONO-4538-06 studies. Cancer Med. 2019;8:5183–93.
crossref pmid pmc
38. Lebbe C, Meyer N, Mortier L, Marquez-Rodas I, Robert C, Rutkowski P, et al. Evaluation of two dosing regimens for nivolumab in combination with ipilimumab in patients with advanced melanoma: results from the phase IIIb/IV CheckMate 511 trial. J Clin Oncol. 2019;37:867–75.
crossref pmid pmc
39. Morse MA, Overman MJ, Hartman L, Khoukaz T, Brutcher E, Lenz HJ, et al. Safety of nivolumab plus low-dose ipilimumab in previously treated microsatellite instability-high/mismatch repair-deficient metastatic colorectal cancer. Oncologist. 2019;24:1453–61.
crossref pmid pmc
40. Sharma P, Sohn J, Shin SJ, Oh DY, Keam B, Lee HJ, et al. Efficacy and tolerability of tremelimumab in locally advanced or metastatic urothelial carcinoma patients who have failed first-line platinum-based chemotherapy. Clin Cancer Res. 2020;26:61–70.
crossref pmid
41. Tomita Y, Kondo T, Kimura G, Inoue T, Wakumoto Y, Yao M, et al. Nivolumab plus ipilimumab versus sunitinib in previously untreated advanced renal-cell carcinoma: analysis of Japanese patients in CheckMate 214 with extended follow-up. Jpn J Clin Oncol. 2020;50:12–9.
crossref pmid
42. De Velasco G, Je Y, Bosse D, Awad MM, Ott PA, Moreira RB, et al. Comprehensive meta-analysis of key immune-related adverse events from CTLA-4 and PD-1/PD-L1 inhibitors in cancer patients. Cancer Immunol Res. 2017;5:312–8.
crossref pmid pmc
43. Minkis K, Garden BC, Wu S, Pulitzer MP, Lacouture ME. The risk of rash associated with ipilimumab in patients with cancer: a systematic review of the literature and meta-analysis. J Am Acad Dermatol. 2013;69:e121–8.
crossref pmid
44. Tarhini A. Immune-mediated adverse events associated with ipilimumab CTLA-4 blockade therapy: the underlying mechanisms and clinical management. Scientifica (Cairo). 2013;2013:857519
crossref
45. Baxi S, Yang A, Gennarelli RL, Khan N, Wang Z, Boyce L, et al. Immune-related adverse events for anti-PD-1 and anti-PD-L1 drugs: systematic review and meta-analysis. BMJ. 2018;360:k793.
crossref pmid pmc
46. Almutairi AR, McBride A, Slack M, Erstad BL, Abraham I. Potential immune-related adverse events associated with monotherapy and combination therapy of ipilimumab, nivolumab, and pembrolizumab for advanced melanoma: a systematic review and meta-analysis. Front Oncol. 2020;10:91.
crossref pmid pmc
47. Wolchok JD, Neyns B, Linette G, Negrier S, Lutzky J, Thomas L, et al. Ipilimumab monotherapy in patients with pretreated advanced melanoma: a randomised, double-blind, multicentre, phase 2, dose-ranging study. Lancet Oncol. 2010;11:155–64.
crossref pmid
48. Topalian SL, Hodi FS, Brahmer JR, Gettinger SN, Smith DC, McDermott DF, et al. Safety, activity, and immune correlates of anti-PD-1 antibody in cancer. N Engl J Med. 2012;366:2443–54.
crossref pmid pmc
49. Hassel JC, Heinzerling L, Aberle J, Bahr O, Eigentler TK, Grimm MO, et al. Combined immune checkpoint blockade (anti-PD-1/anti-CTLA-4): evaluation and management of adverse drug reactions. Cancer Treat Rev. 2017;57:36–49.
crossref pmid
50. Goldinger SM, Stieger P, Meier B, Micaletto S, Contassot E, French LE, et al. Cytotoxic cutaneous adverse drug reactions during anti-PD-1 therapy. Clin Cancer Res. 2016;22:4023–9.
crossref pmid
51. Kahler KC, Hassel JC, Heinzerling L, Loquai C, Mossner R, Ugurel S, et al. Management of side effects of immune checkpoint blockade by anti-CTLA-4 and anti-PD-1 antibodies in metastatic melanoma. J Dtsch Dermatol Ges. 2016;14:662–81.
crossref
52. Freeman-Keller M, Weber JS. Anti-programmed death receptor 1 immunotherapy in melanoma: rationale, evidence and clinical potential. Ther Adv Med Oncol. 2015;7:12–21.
crossref pmid pmc
Editorial Office
Korean Cancer Association
Room 1824, Gwanghwamun Officia
92 Saemunan-ro, Jongno-gu, Seoul 03186, Korea
TEL: +82-2-3276-2410   FAX: +82-2-792-1410   E-mail: journal@cancer.or.kr
About |  Browse Articles |  Current Issue |  For Authors and Reviewers
Copyright © Korean Cancer Association.                 Developed in M2PI