Introduction
A desmoid tumor (aggressive fibromatosis) is a fibroproliferative neoplasm arising from deep connective tissues. A stepwise approach including active surveillance is established as no metastatic potential and spontaneous tumor regression are observed [1]. Excision is the mainstay of treatment, but the postsurgical recurrence rate is high [2,3]. For unresectable or recurrent desmoid tumors, a variety of systemic therapeutic options are available, including tamoxifen, nonsteroidal anti-inflammatory drugs (NSAIDs), interferons, and chemotherapy [4–8]. Recently, sorafenib induced durable response and led to its approval for the disease treatment [9]. Imatinib is a new treatment option in unresectable, progressive, or recurrent desmoid tumors [10–12]. In addition to its promising efficacy (6%–15% response rate), the favorable toxicity profiles support its long-term use for salvage treatment. In imatinib-responsive diseases, such as gastrointestinal stromal tumors or chronic myeloid leukemia, specific mutations or chromosomal translocations have been reported [13–15]. However, in desmoid tumors, no molecular abnormalities in imatinib-sensitive kinases have been observed [10,11]. Therefore, molecular mechanisms by which this rare tumor responds to imatinib are poorly understood.
In this study, we conducted a multicenter phase II trial to evaluate the efficacy of imatinib in patients with relapsing or progressive desmoid tumors (ClinicalTrials.gov, NCT02495519, registered July 13, 2015 retrospectively registered). To understand the molecular basis of the clinical responses to imatinib, we performed whole-genome sequencing to identify potential markers. Owing to limited insights gained from protein-coding mutations, we extended our analyses to noncoding regulatory regions. Our gene-wise recurrence model using 1,009 pan-cancer whole-genome data indicated that NOTCH2 regulatory mutations are associated with the response of desmoid tumors to imatinib. We further evaluated the significance of NOTCH2 in transcriptome analysis using RNA-sequencing data. We discovered that HES1, a well-known downstream target of Notch signaling pathway, is directly associated with imatinib sensitivity.
Materials and Methods
1. Patients and treatment
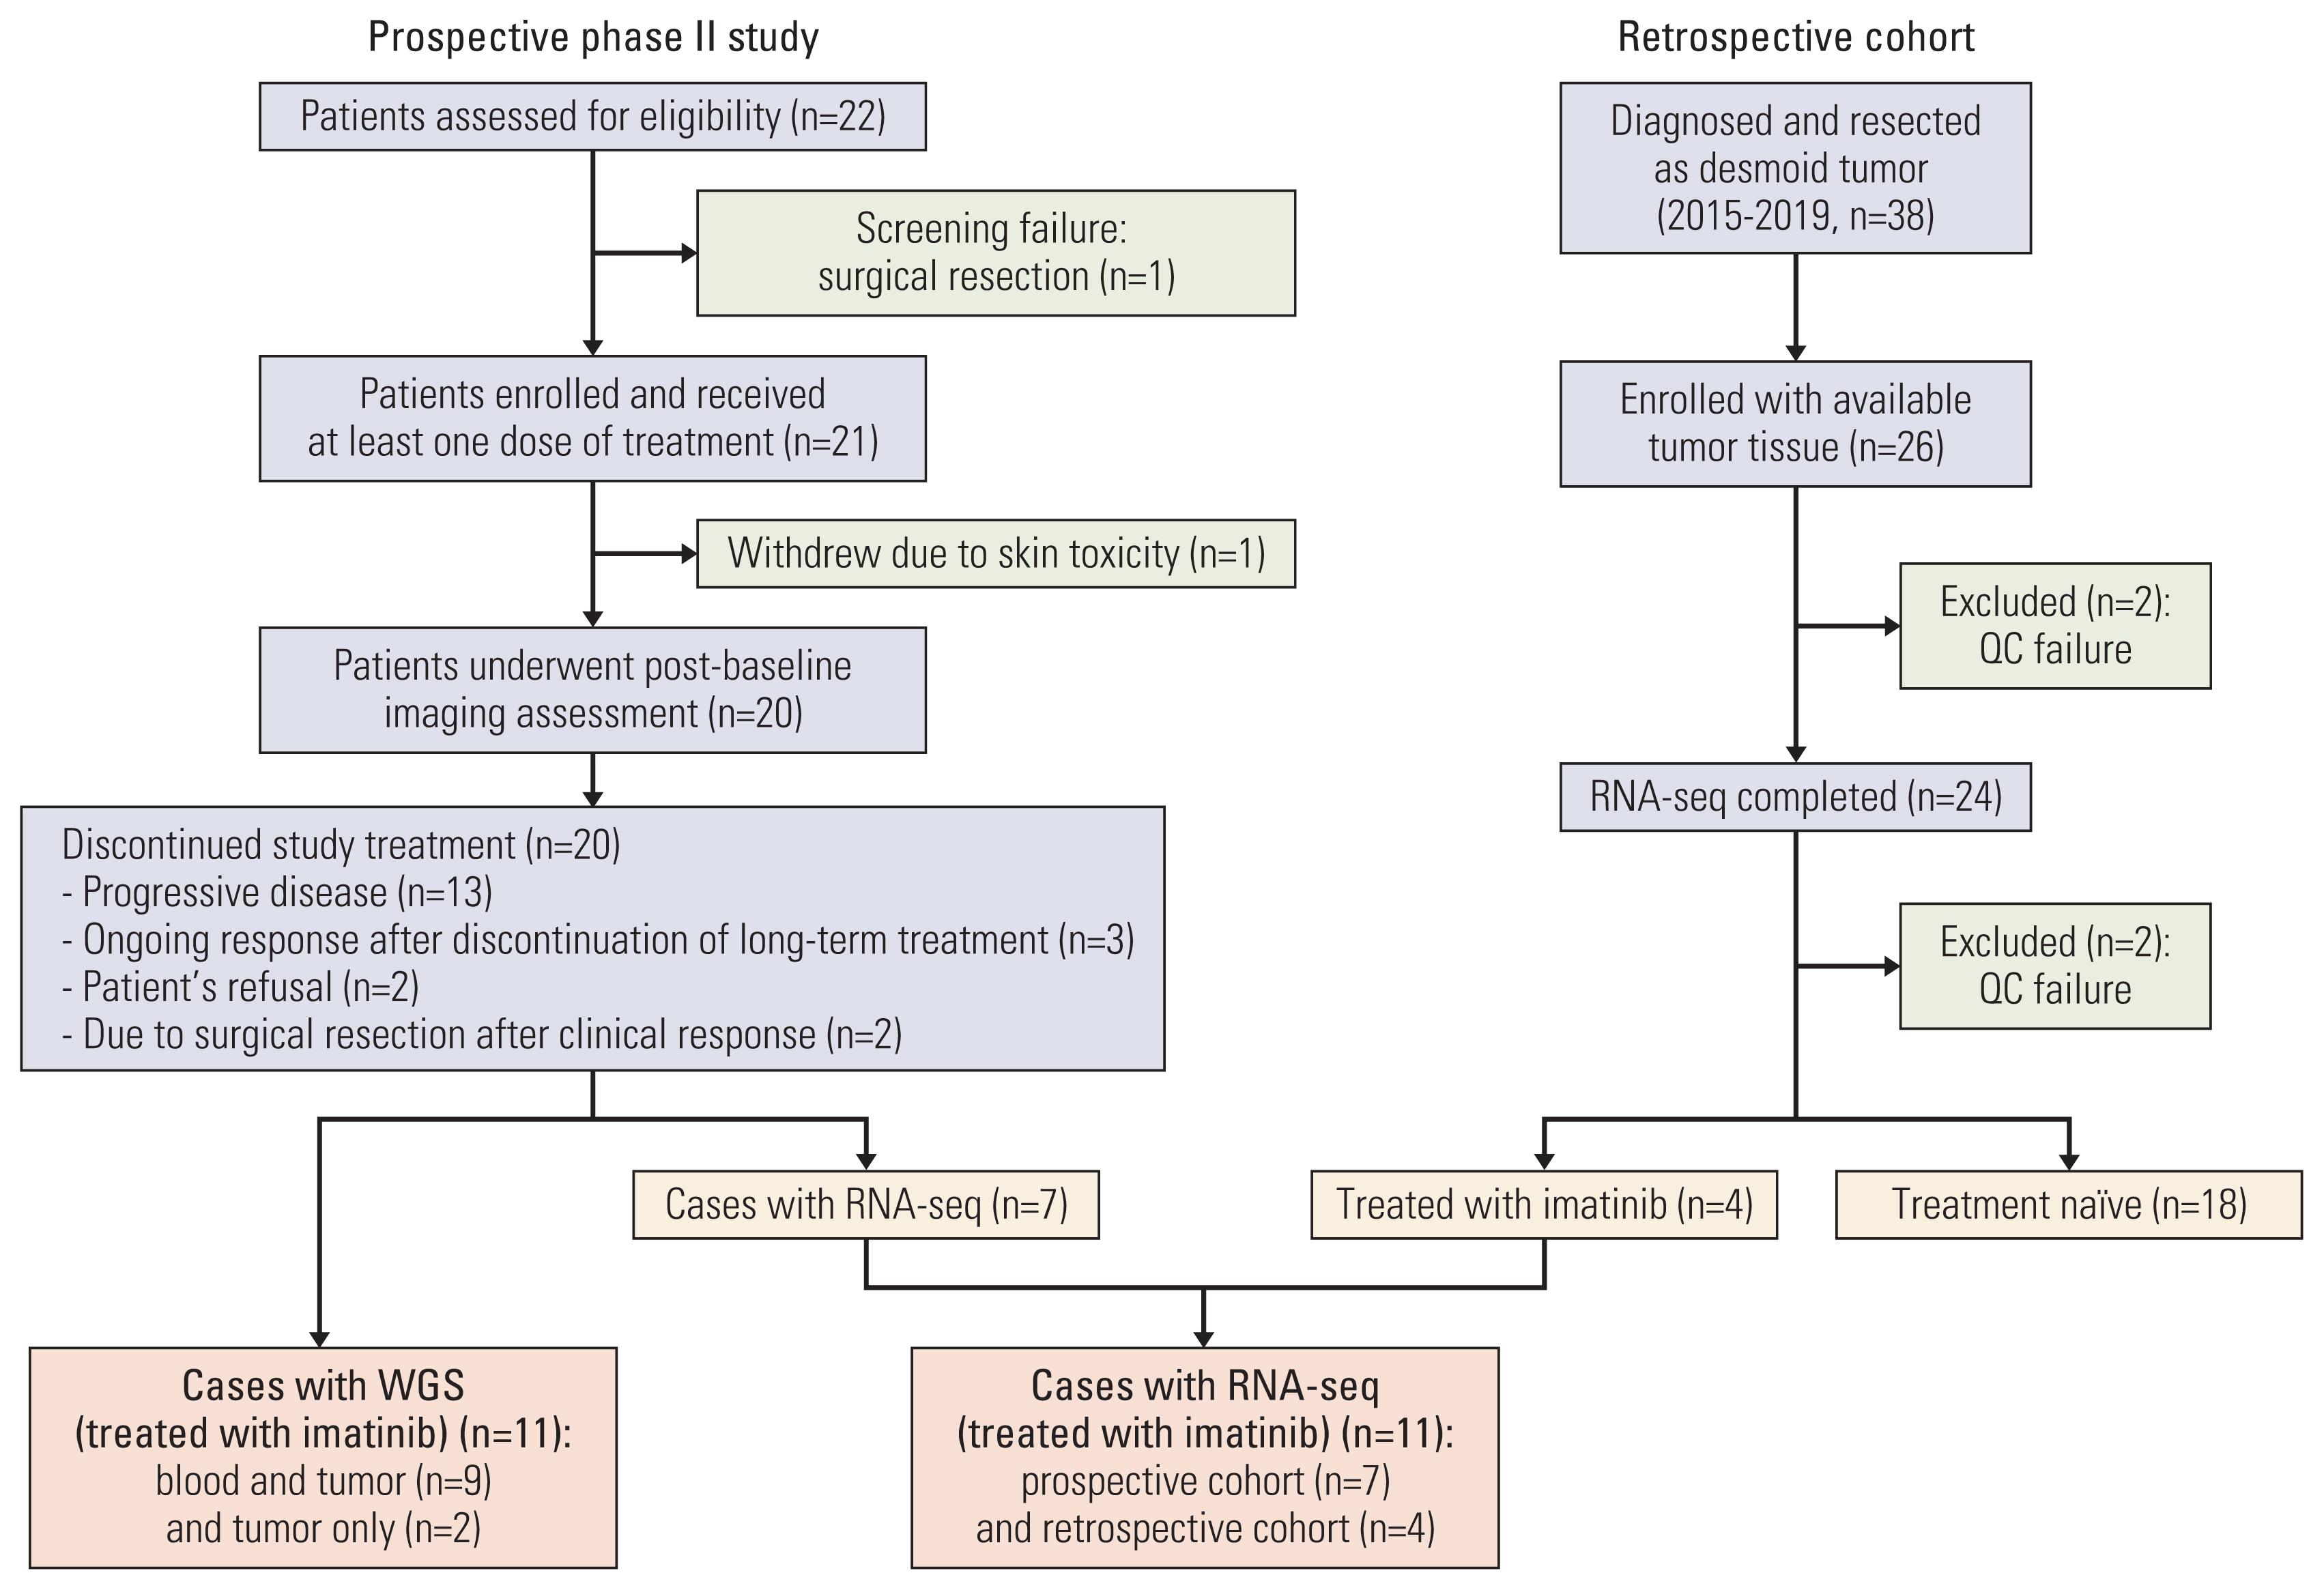
Patients with advanced desmoid tumors, defined as patients with radiographic progression after previous treatment, were eligible for prospective phase II study. Key inclusion criteria were as follows: age ≥ 10 years, Eastern Cooperative Oncology Group performance status of 0 to 2, and adequate hematologic and renal function. Patients were treated with 400 mg of imatinib mesylate (Glima, Boryung Pharmaceutical Co., Ltd., Seoul, Korea) daily until progression or unacceptable toxicity. Toxic effects were graded according to the National Cancer Institute—Common Toxicity Criteria v. 4.03. Disease was assessed every 8 weeks for the initial 32 weeks and then every 16 weeks according to RECIST (Response Evaluation Criteria in Solid Tumors) v1.1 [16]. Briefly, patients who experienced grade 3/4 toxicity or intolerable grade 2 toxicity stopped treatment and then restarted at a reduced dose (300 mg/day or 200 mg/day). Surgically resected formalin-fixed paraffin-embedded (FFPE) tissue samples obtained prior to radiotherapy or chemotherapy were subjected to transcriptome sequencing (Fig. 1). Of those, four cases were treated with imatinib and the remaining 20 were treatment naïve.
2. DNA extraction and quality assessment
Whole genome sequencing was performed using pretreatment tumor excision samples as well as matched blood samples. Briefly, 4-mm-thick sections with a tumor content of ≥ 80% were obtained, and ≥ 2 μg of DNA was extracted using the Maxwell 16 FFPE Plus LEV DNA Purification Kit (Promega, Madison, WI). For peripheral blood mononuclear cells (PBMCs), genomic DNA was extracted using the QIAamp DNA Mini Kit (Qiagen, Hilden, Germany) as per the manufacturer’s instructions.
3. DNA library construction and whole-genome sequencing
Library preparation was performed using the TruSeq Nano DNA Library Preparation Kit (Illumina, San Diego, CA) following the manufacturer’s instructions. Illumina utilizes a unique “bridged” amplification reaction on the surface of the flow cell. A flow cell containing libraries was prepared using the cBot Fluidics Station and was then loaded into the HiSeq X-10 sequencer (Illumina) for automated cycles of extension and imaging. Sequencing-by-Synthesis cycles were repeated to achieve a paired-end read length of 2×150 bp.
4. RNA library construction and whole transcriptome sequencing
Total RNAs were extracted and purified from frozen tumor samples with ReliaPrep FFPE Total RNA Miniprep System (Promega) according to the manufacturer’s procedures. Amount of RNA and its quality were checked on an Agilent RNA 6000 Nano Kit (Agilent Technologies, Santa Clara, CA). For analysis of RNA-sequencing data, we prepared mRNA sequencing libraries as paired-end reads with a length of 100 bases using the SMARTer Stranded Total RNA-seq kit v2-Pico Input Mammalian according to the manufacturers’ protocols. Briefly, mRNA molecules were purified and fragmented from 2 μg of total RNA. The libraries were sequenced as paired-end reads (2×150 bp) using the NovaSeq 6000 (Illumina).
5. Whole genome data processing
To process whole-genome sequencing data of desmoid tumors, we adopted the Genome Analysis Tool Kit (GATK) v3.7 best practice provided by the Broad Institute [17]. Briefly, we mapped qualified paired-end reads to the human reference genome (hg19) with Burrows-Wheeler Aligner 0.7.15 [18]. Subsequently, we filtered polymerase chain reaction duplicates using Picard tools 2.8.2 to remove potential bias that occurred during sequencing processes. Then, we performed recommended procedures, such as local realignment and base quality recalibration to extract analysis-ready reads.
6. Somatic variant detection
MuTect2 [19] of the GATK pipeline with default parameters was used to identify somatic single nucleotide variants (SNVs) and small insertions/deletions (indels). The processed whole-genome-sequencing data for tumor and matched normal samples (PBMCs) were used in BAM format as inputs for Mutect2 [19]. Somatic variants were annotated using ANNOVAR [20]. Some candidate variants were manually inspected using Integrative Genomics Viewer [21]. Population-level allele frequencies of candidates were obtained using Genome Aggregation Database (gnomAD) [22]. For two samples with tumor data only, normal sample data for one of the nine other patients was used as matched normal control for variant calling. A sample that was sequenced in the same batch with a read depth of greater than 30 was used. The variants were further filtered using gnomAD to obtain putative somatic mutations in the tumor-only samples.
7. Scoring gene-wise recurrence of functional variants
Our previously developed gene-wise recurrence model was used [23]. Conventionally, mutations are considered recurrent if and only if they occur at the same genomic location across multiple samples. Mutations are considered oncogenic when their recurrence exceeds a certain threshold [24]. However, this definition of recurrence is inappropriate for analyses of noncoding regions owing to their vast size. Thus, we consider mutations recurrent if they occur in functional regions of the same gene, even if they are not recurrent in a site-specific manner. In particular, we focused on mutational events in cis-regulatory regions of a mammalian gene dispersed across a long range in the genome [25]. Genes were defined based on the GENCODE v.19 gene set mapped to GRCh37 [26].
To identify coding and noncoding mutations with significant functional consequences, deleterious effects of each SNV were predicted using two algorithms, Combined Annotation-Dependent Depletion (CADD) [27] and Deleterious Annotation of genetic variants using Neural Networks (DANN) [28]. Both models were trained to distinguish benign variants from deleterious variants [27,28]. For multiple mutations in the same gene, the one with the highest score for deleteriousness was selected to represent the functional consequence.
8. Reference whole-genome and transcriptome datasets
To characterize the functional effects of NOTCH2 noncoding mutations, a large-scale pan-cancer dataset consisting of somatic variants from whole-genome sequencing data and transcriptome data for tumor and matched normal samples were used. VCF files for somatic variant calling and gene expression matrices containing FPKM (fragments per kilobase of transcript per million mapped reads)-upper quantile values were obtained from the Pan-Cancer Analysis of Whole Genomes (PCAWG) Project [29].
9. RNA-sequencing data processing and quality control
We generated RNA-sequencing data of 31 desmoid tumor patients. We removed adapter sequences using Cutadpt [30], and aligned the trimmed reads using STAR [31] with hg19. Gene expression was quantified using RSEM [32]. Quality control check at pre-alignment step was conducted using FASTQC and at post-alignment step using RSeQC [33]. Quality control (QC) results were visualized with MultiQC [34]. At post-alignment step, we noticed two patients with potential problems in read distribution, and infer experiment criteria. Thus, we excluded those samples from future analysis.
10. Bioinformatics and statistical analyses
The chi-square test was used to assess correlations between marker status and clinical significance. All correlation analysis was conducted using spearman correlation. To assess statistical significance between responders and non-responders of imatinib, we calculated Mann-Whitney U test. All tests were two-sided and p < 0.05 is considered significant. Cleveland, scatter and box plots were generated by using ggplot2 R package and matplotlib python package.
To conduct enrichment analysis, we adopted two approaches. First of all, we identified genes that are significantly correlated with imatinib sensitivity and used those genes as input for EnrichR [35]. As an alternative step, we conducted Gene Set Enrichment Analysis (GSEA) between responders and non-responders using C2, C5, C6, and Hallmark MSigDB gene sets [36]. C5 Notch category was defined as Notch-related terms present in C5 category.
Progression-free survival was calculated from start date of imatinib to date of progression or death and progression-free rate at 16 weeks (PFR 16) was defined as proportions of patients without progression at 16 weeks, analyzed using the Kaplan-Meier method (SPSS ver. 18.0, SPSS Inc., Chicago, IL).
Results
1. Sample set, patient outcomes, and toxicity
Total of 21 patients was enrolled between April 2014 and October 2015. One patient withdrew, leaving 20 patients (Fig. 1, S1 Table). Three patients (7, 8, and 13) had a known diagnosis of familial adenomatous polyposis (FAP). Fifteen patients (75%) underwent one previous surgery. Most of the patients had been treated with non-surgical procedures, including radiotherapy (n=6, 30.0%) and/or chemotherapy (n=12, 60.0%).
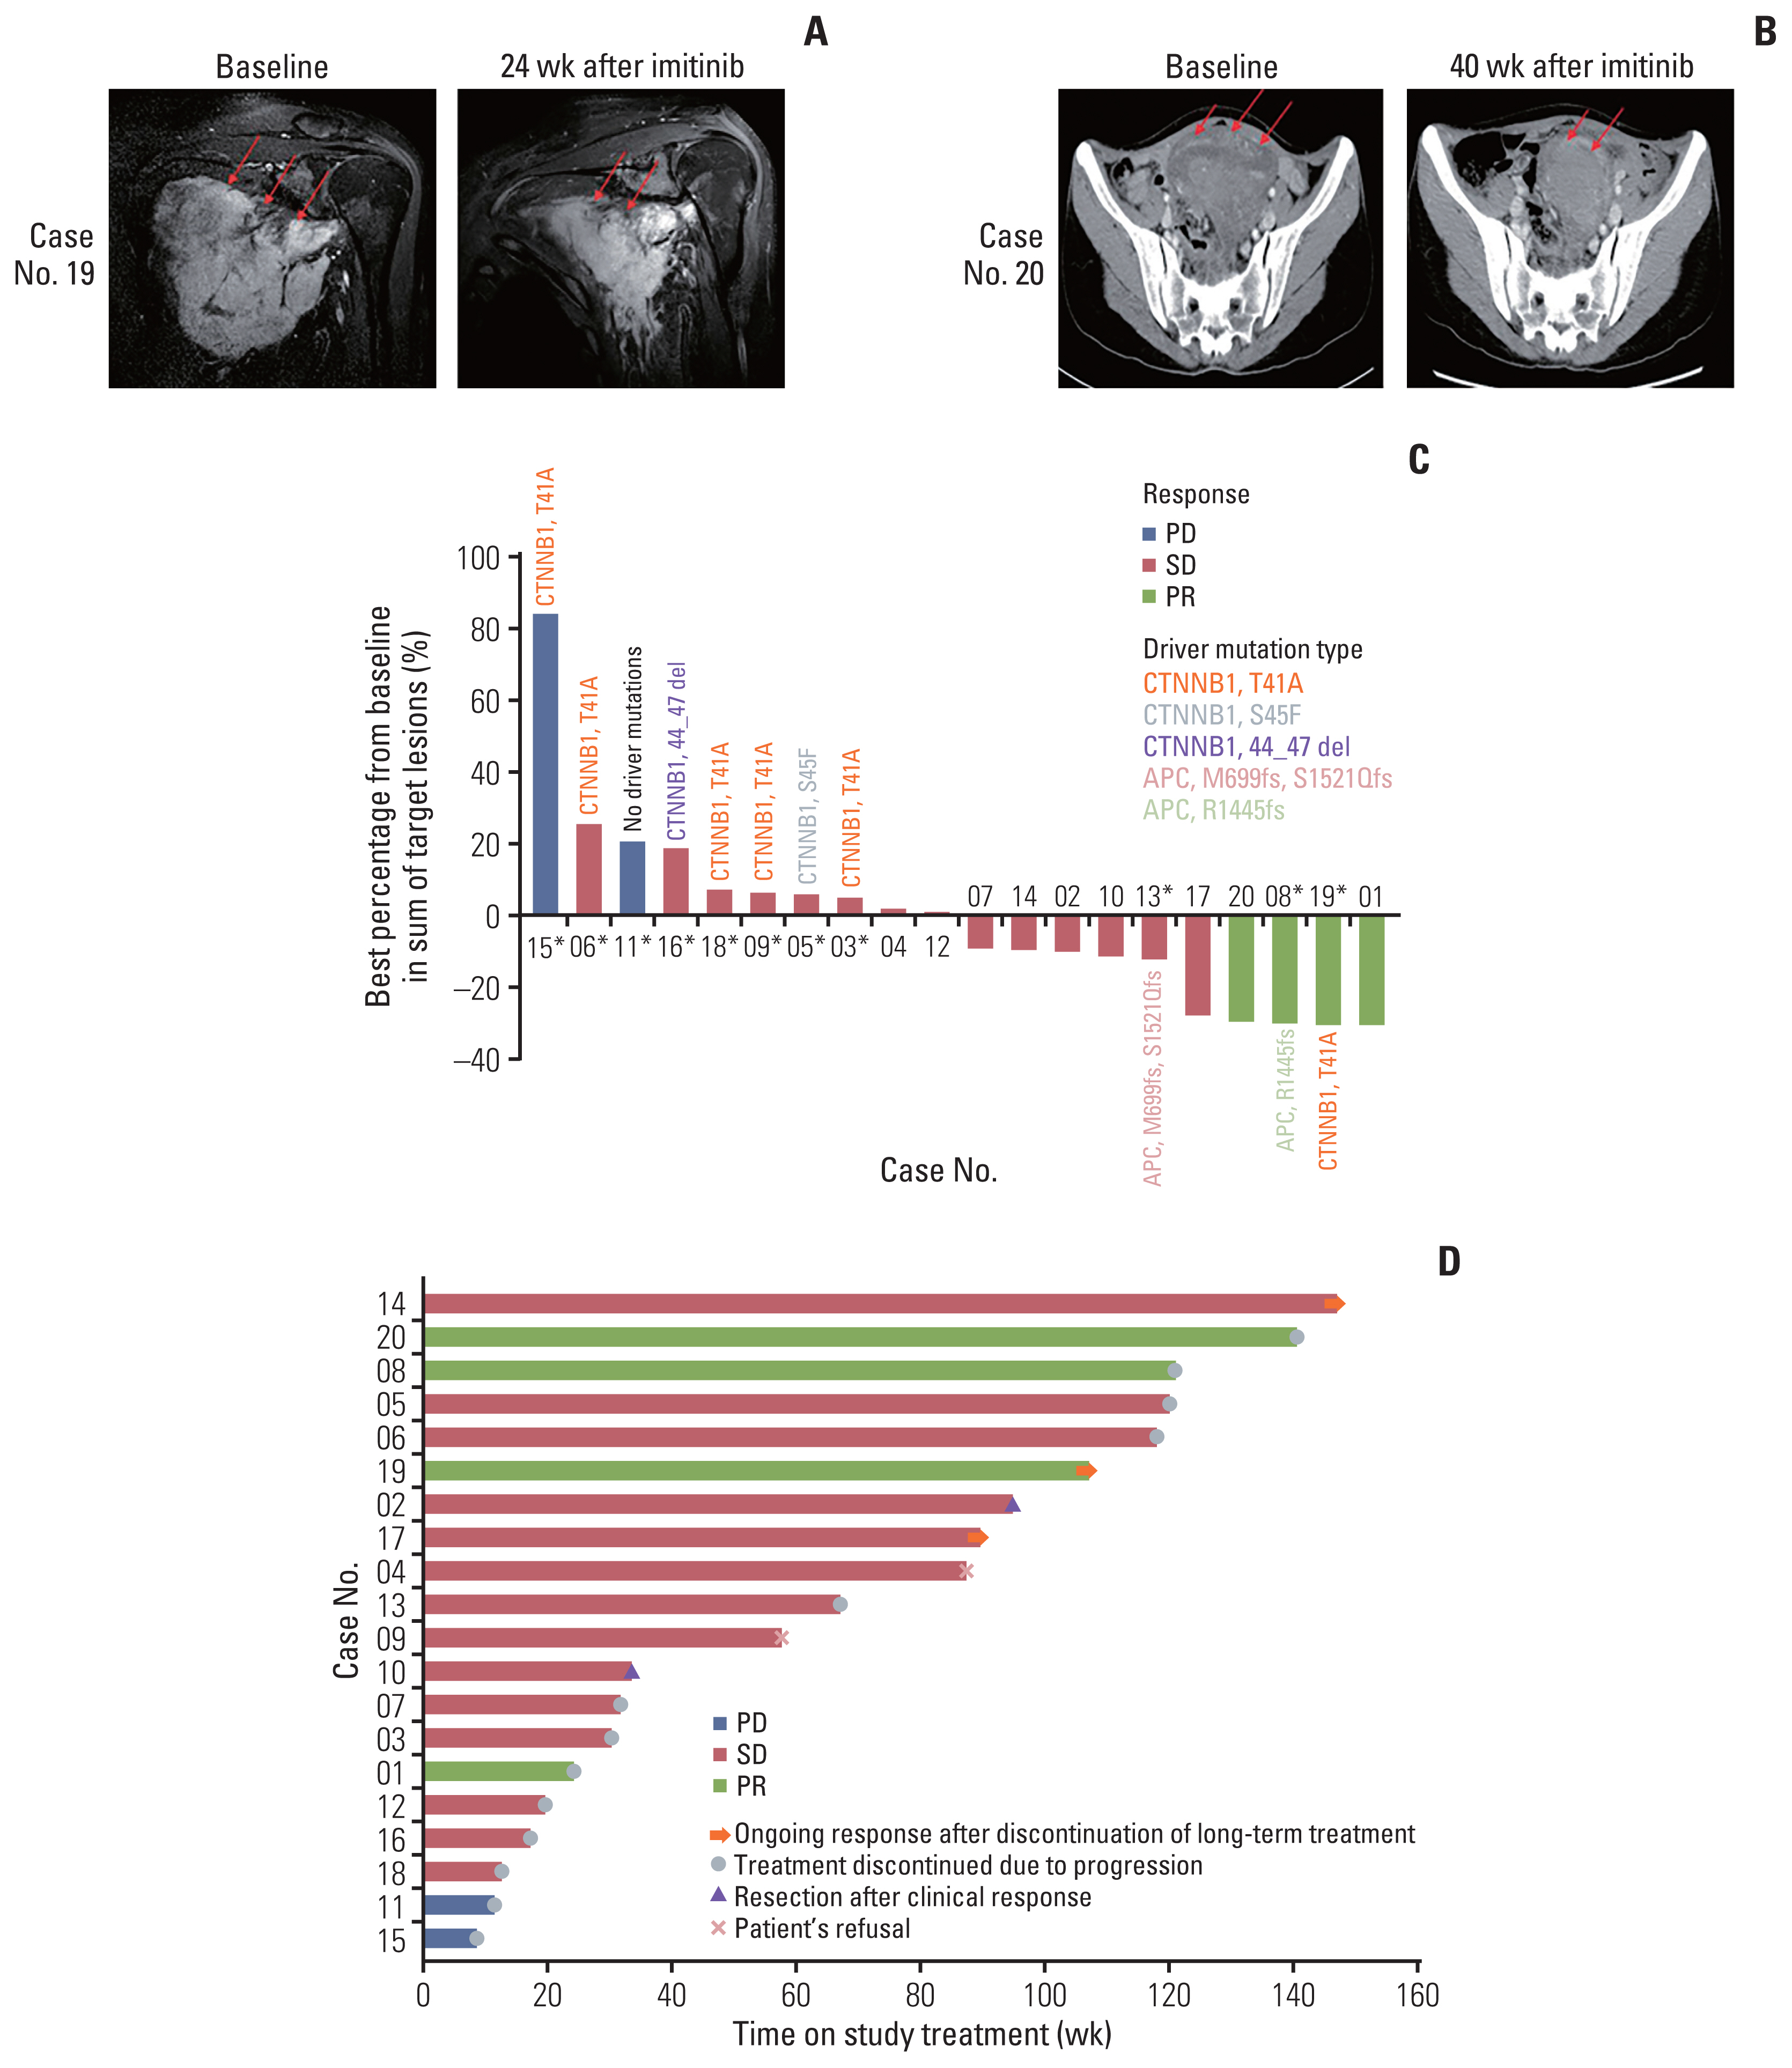
Of the 20 evaluable patients, four (20%) had partial responses (PR) to treatment with durations of 6.7, 26.8 (Fig. 2A), 30.3, and 35.1 (Fig. 2B) months. One PR case had FAP. The PR duration was longer than 1 year for three patients. Fig. 2C provides a waterfall plot of the best response; 14 patients (66.7%) had stable disease (SD), and the clinical benefit rate was 90.0%. The median time to progression was 21.4 months (range, 2.8 to 40.7 months) and PFR 16 was 85% (Fig. 2D).
In terms of toxicity, 400 mg of imatinib was well tolerated with expected grade 3/4 toxicities: neutropenia (n=1), anorexia (n=1), vomiting (n=1), and fatigue (n=1) (S2 Table). Three patients had a one dose level reduction (300 mg/day), and one patient had a reduction of two levels (200 mg/day) owing to toxicity.
2. Results of whole-genome sequencing
After confirming adequate DNA quantities, whole genome sequencing was performed for 11 samples. Two samples (patients 11 and 13) without matched control data were excluded from the primary analysis and used for extensional validation only (Fig. 1). The average read depth was greater than 21.46 (range, 21.46 to 54.05) (S3 Table). By implementing the GATK pipeline from the Broad Institute, we identified 832-4,110 SNVs and indels per sample and used ANNOVAR for annotation (S4 Table).
Next, we examined mutational signatures from annotated variants to identify types of mutational processes [37]. Signature 1A was dominant, accounting for around 88% of signatures (S5 Table), indicating that desmoid tumor variants primarily arise due to errors in replicative polymerases in the DNA repair pathway [37]. The majority of mutations were in intronic regions. Mutations in coding regions were primarily missense and synonymous variants (S6 Fig).
We also investigated alterations of cancer driver genes registered in the COSMIC database [38] and detected CTNNB1 mutations in eight out of 11 samples, while two patients harbored adenomatous polyposis coli (APC) mutations. CTNNB1 and APC mutation sites of patients are summarized in Fig. 2C. All mutations affected phosphorylation sites necessary for the proper degradation of β-catenin [39–41]. Remarkably, no other mutations in COSMIC cancer driver genes were detected, emphasizing the prominent role of the Wnt/β-catenin signaling pathway in desmoid tumor progression [8].
3. Gene-wise recurrence analysis of potential cancer-associated genes
To identify potential cancer-associated mutations in desmoid tumors, we employed gene-wise recurrence analysis of mutations in noncoding regions, according to previously developed method [23]. Briefly, the model assumes that mutations in multiple patients are recurrent if they affect the same gene (Fig. 3A). Recurrently affected genes were defined as those with mutations in at least two samples. This strategy allowed us to evaluate noncoding regions with potentially significant impacts on gene regulation with limited sample size. NOTCH2, RGPD2, and ARHGAP11B were identified as strong candidates (Fig. 3B).
4. Correlation between gene-wise scores and imatinib sensitivity
We examined the association between the change in tumor volume after imatinib treatment and the deleteriousness score of recurrently mutated genes. In case of NOTCH2, tumor volume changes were highly correlated with both CADD (R=–0.797, p=0.01) and DANN scores (R=–0.831, p=0.006) (Fig. 3B and C, S7 Table). This correlation was maintained even when two tumor-only samples (patient 11 and 13) were included (Fig. 3C). According to the annotated information of somatic variants in NOTCH2, three (patients 3, 5, and 8) and four (patients 9, 11, 13, and 18) variants were intergenic and intronic, respectively, while only one (patient 19) variant was nonsynonymous (S8 Table). Using gnomAD database, we found that the allele frequencies of the NOTCH2 variants were extremely low (0%–1.13%), indicating that they were likely somatic. These results suggest that the regulation of NOTCH2 at the gene level may contribute to the desmoid tumor response to imatinib.
5. Regulatory role of NOTCH2 mutations
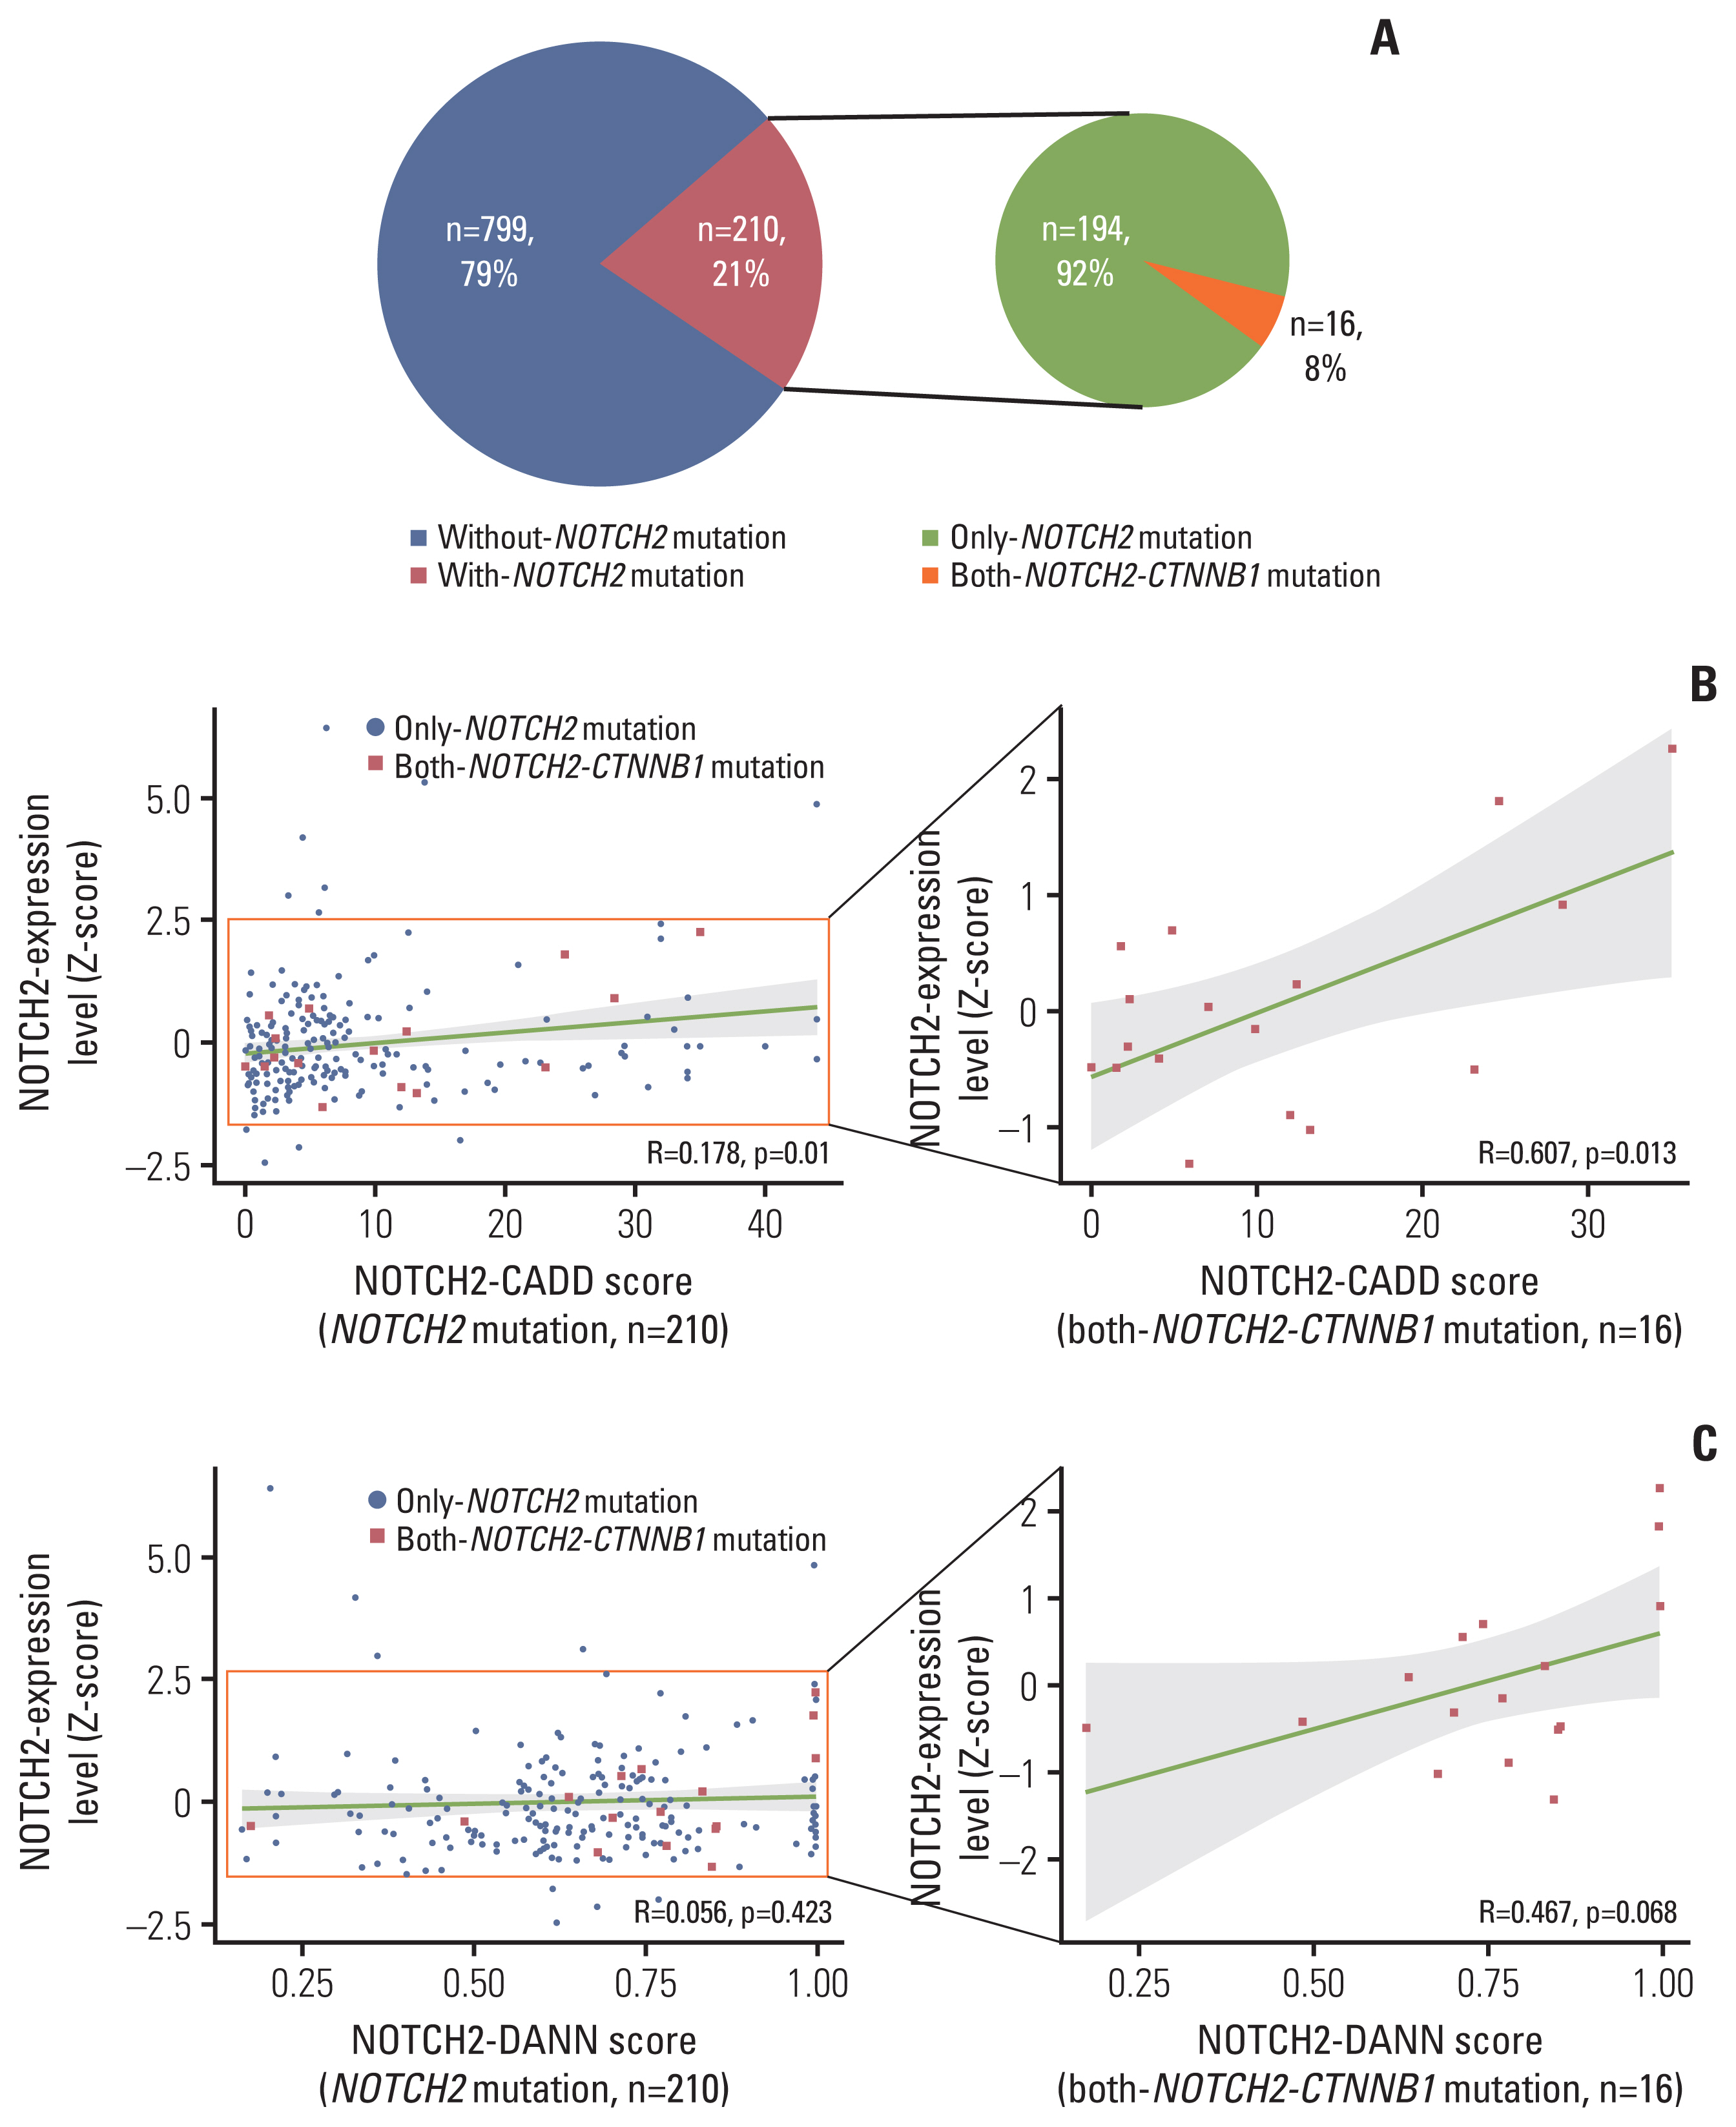
To evaluate the regulatory effects of NOTCH2 mutations, we interrogated RNA sequencing and somatic mutation profiles from PCAWG datasets (n=1,009). For comparison across cancer types, we transformed the NOTCH2 expression levels to Z-scores within each cancer type and identified samples with NOTCH2 mutations. Considering the role of CTNNB1 missense mutations in desmoid tumors [8], we further selected both-NOTCH2-CTNNB1 mutants in the PCAWG data (Fig. 4A, S9 Table).
NOTCH2 expression levels were more highly correlated with CADD scores for both-NOTCH2-CTNNB1 mutation group (R=0.607, p=0.013) than for NOTCH2 mutation-only group (R=0.178, p=0.01) (Fig. 4B). The same trends were observed when DANN score was used for variant scoring (R=0.467) (Fig. 4C), although the correlation was only marginally significant (p=0.068). These results suggest that genetic interactions between NOTCH2 noncoding mutations and CTNNB1 missense mutations may influence the NOTCH2 expression level.
6. Role of NOTCH family members and HES1 in imatinib sensitivity
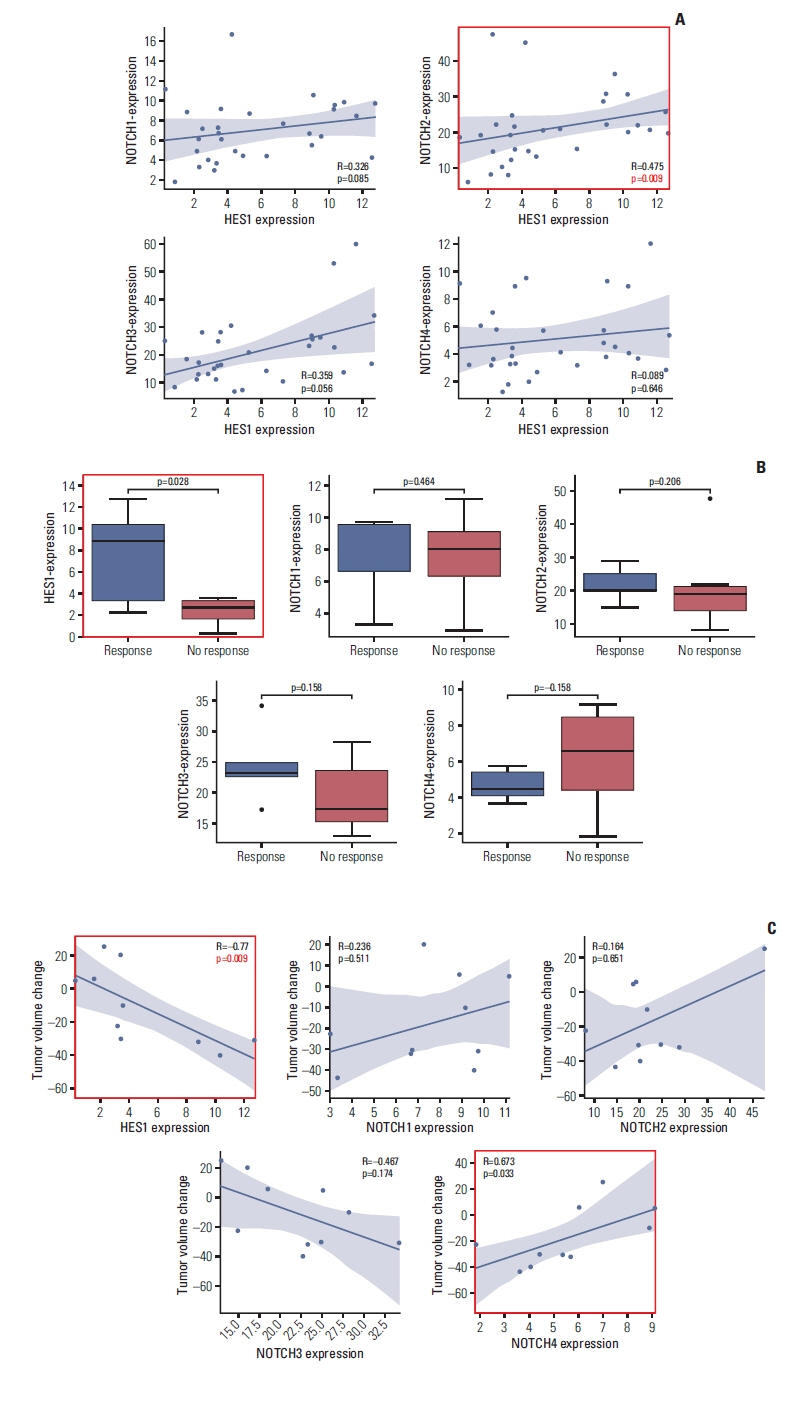
To validate significance of our finding, we analyzed RNA-sequencing data of 29 desmoid tumor patients (Fig. 1, S10 Table). We focused on Notch family members, including NOTCH2, and HES1, a marker of stemness [42] that has been implicated as a target of Notch signaling pathway [43] and marker of imatinib sensitivity [44]. We first investigated whether expression levels of Notch family members and HES1 are correlated. We calculated spearman correlation between the genes, and discovered that NOTCH2 expression was significantly correlated with HES1 expression (p=0.0091568) while expressions of other Notch genes were not (Fig. 5A). This recapitulates the association between HES1 and NOTCH2 detected in whole-genome sequencing analysis. We also noticed that all Notch family members are significantly correlated with each other (S11 Fig.). This suggests that other Notch family members can potentially participate in regulation of HES1 expression although NOTCH2 is most directly associated with HES1.
Next, we examined whether expression of Notch family members or HES1 is associated with imatinib response. We classified patients into responders (PR, n=5) or non-responders (SD/progressive disease, n=6) on the basis of clinical implementation, and compared expression values between two groups. Strikingly, we found that none of Notch family members had statistical power to distinguish two groups. Intriguingly, HES1 was significant in discriminating patients’ response (p=0.028) (Fig. 5B). This is in accordance with report that overexpression of HES1 sensitizes cells to imatinib in chronic myeloid leukemia model [44]. Furthermore, we calculated spearman correlation between response rate and expression levels. Initially, we found no correlation between HES1 or Notch family genes with tumor volume change, with marginal significance in HES1 (p=0.070). However, after removing outlier (defined as patient with highest gene expression), we found that HES1 was significantly correlated with clinical response (p=0.009) (Fig. 5C). Still, none of Notch members, except NOTCH4, achieved statistical significance. Overall, HES1 was the most significant marker of imatinib sensitivity.
7. Enrichment analysis of response-associated genes
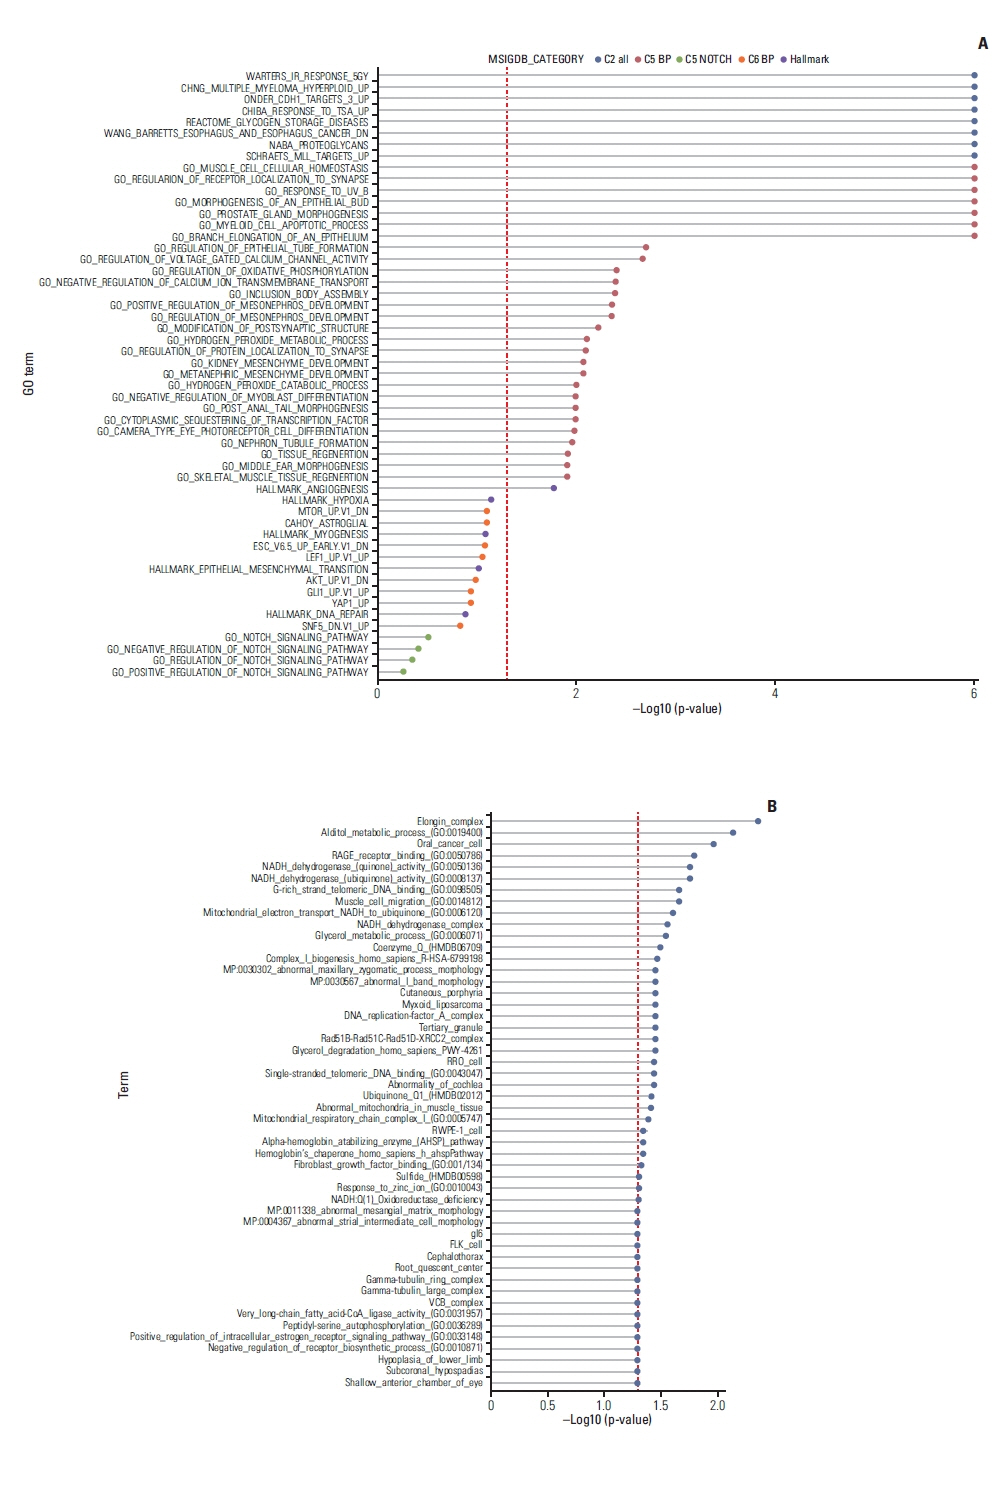
To identify biological pathways that are associated with imatinib sensitivity, we first conducted GSEA between responders and non-responders (Fig. 6A). Differentially expressed genes were enriched in diverse biological pathways including muscle cell cellular homeostasis, negative regulation of myoblast differentiation, and skeletal tissue regeneration, angiogenesis and regulation of oxidative phosphorylation. We also performed enrichment analysis using genes that are significantly correlated with imatinib sensitivity (Fig. 6B). Similar terms, such as fibroblast growth factor binding, muscle cell migration, and oxidative phosphorylation, were enriched. Among these terms, we found that glucose metabolism and mitochondrial respiration have been closely linked to imatinib sensitivity [45] and are upregulated in naïve pluripotent stem cells [46] in previous researches. In addition, angiogenesis is a well-known feature of mesenchymal stem cells [47]. Collectively, we propose that these terms, such as oxidative phosphorylation and angiogenesis, and HES1 all point to the significance of mesenchymal stem cell population that are prone to imatinib in desmoid tumor.
Discussion
Using whole-genome and transcriptome sequencing, we performed integrative molecular characterization of desmoid tumor in patients receiving imatinib treatment. Our analyses suggest HES1 overexpression, potentially regulated by NOTCH2, can serve as a predictor of the clinical response to imatinib in desmoid tumor patients. To our knowledge, this is the first integrative study to characterize molecular determinants of the response to imatinib in desmoid tumor.
Our coding-region analyses recapitulated previous findings on the prevalence of CTNNB1 and APC mutations [48]. Unfortunately, these mutations were not associated with clinical responses to imatinib. However, we discovered that mutations in noncoding regulatory regions of NOTCH2 are positively correlated with the clinical response to imatinib. Moreover, our investigation of PCAWG samples revealed that noncoding mutations in NOTCH2 regions increase expression. Importantly, NOTCH2 expression was significantly correlated with HES1, and HES1 was indicative of imatinib sensitivity in our desmoid cohort. We noticed that removal of one outlier restored statistical significance when assessing correlation between HES1 and tumor volume change. Still, our correlation analysis suggests that HES1 expression is the major determinant of imatinib sensitivity. Other minor factors of imatinib sensitivity need to be determined to fully elucidate mechanism of imatinib in desmoid tumor. Taken together, we suggest that HES1 and NOTCH2 overexpression is a predictor of the anti-cancer effects of imatinib on desmoid tumors.
Our study is not the very first attempt to investigate the significance of Notch signaling in desmoid tumor [43,49]. Based on multiple evidences, small molecule inhibitors, such as γ-secretase inhibitor, siRNA, and monoclonal antibody against Notch pathway were designed to treat desmoid tumor [50]. Studies have confirmed that activation of NOTCH2 leads to overexpression of HES1 and are accompanied by proliferation, immature morphology and aggressiveness in acute kidney injury model [51] and hepatocellular carcinoma model [52]. Of note, Notch signaling and HES1 have been associated with response to imatinib in chronic myeloid leukemia cells [44,53], providing robust evidence for Notch-HES1 axis in mechanism of imatinib in desmoid tumor. Surprisingly, however, no research reported its association with clinical response of imatinib in desmoid tumor until now.
The mechanism underlying the tumor response to imatinib is still not fully understood. In agreement with our findings, multiple lines of evidence support their significance in desmoid tumor. In a preclinical study, imatinib inhibits Notch signaling by increasing the proteosomal degradation of intracellular Notch. Furthermore, a primary effector of Notch signaling, HES1, decreased as the imatinib concentration increased [54]. In a neurodegenerative condition, Alzheimer disease, imatinib results in the dose-dependent inhibition of γ-secretase activity [55]. Similarly, NSAIDs, another standard treatment for desmoid tumors, alter γ-secretase activity [56]. Taken together, these findings support the predictive value of Notch and HES1 as therapeutic strategy.
The Notch pathway exhibits crosstalk with the Wnt signaling cascade [57] and is involved in the regulation of tumor microenvironments and the maintenance of cancer stem cells [58–60]. With NOTCH1 activation, desmoid tumors showed high expression levels of NOTCH1 and its downstream transcription factor HES1 [43], of which transcriptional activity is dependent on NOTCH2 [61]. Thus, targeting γ-secretase to prevent Notch cleavage has been suggested as a novel therapeutic approach [62,63]. A phase II trial of the γ-secretase inhibitor PF-03084014 demonstrated a promising efficacy, with a response rate of 29% for patients with progressive desmoid tumors [63]. Furthermore, the efficacy of PF-03084014 is high in tumors with elevated expression of genes in the Notch and Wnt pathways [64].
We sought to explain the increased correlation between NOTCH2 mutation scores and NOTCH2 expression levels when considering the CTNNB1 mutation status. A previous study has shown that the TCF4/β-catenin complex binds to the promoters of Notch signaling pathway genes, including NOTCH2 [65]. In the absence of the TCF4/β-catenin complex, the transcription machinery cannot be assembled at regulatory regions and fails to induce NOTCH2 expression, thereby preventing NOTCH2 regulatory mutations from exerting effects. We speculate that the hyperactivity of the TCF4/β-catenin complex induced by CTNNB1 msissense mutations leads to the constitutive activation of Notch signaling. This allows NOTCH2 regulatory mutations to alter gene expression levels, leading to a high correlation between deleteriousness and transcript levels. Further investigations, including functional studies, are needed to validate the mode of action of imatinib.
As mentioned earlier, mutation status of driver genes failed to discriminate patients who will respond to imatinib. We overcame this hurdle with analysis of noncoding mutations, providing rationale to investigate Notch signaling and its downstream target HES1 to interpret molecular mechanism of imatinib. Thus, significance of noncoding mutation confers huge advantage to whole-genome sequencing data over whole-exome sequencing data. Despite such significance, we acknowledge several limitations of our study. First of all, we are aware that limited sample size hinders more comprehensive study of desmoid tumor. For example, although we were initially unable to obtain statistical significance for NOTCH2 in Fig. 5B (responder versus non-responder analysis), removal of outlier restored statistical significance (p-value from 0.2 to 0.07), proving that NOTCH2 is a biologically meaningful biomarker. Rarity of desmoid tumor obscured the statistical power, and increased sample size will endow power to rescue unrecognized candidates. Also, we admit lack of functional study. Collectively, multiple evidences point out to Notch-HES1 axis in various studies, its significance in response to imatinib, and role of HES1 in stemness. Thus, future work should validate both clinical and biological significance of HES1 in desmoid tumor to gain insight into this aggressive rare tumor.
In conclusion, using whole-genome sequencing with gene-wise recurrence model and transcriptome of desmoid tumor, we propose that overexpression of NOTCH2 and HES1 is the marker of sensitivity for the anti-cancer effects of imatinib on desmoid tumors. Our results suggest that HES1 should especially be considered in clinical settings when using imatinib to treat this rare and challenging disease.