Introduction
Epithelial ovarian cancer (EOC) is a fatal gynecologic malignancy, and its incidence has steadily increased over the past decade [1,2]. It was estimated that 225,000 new cases of invasive cancer involving the ovary would be diagnosed worldwide in the year 2008; however, in 2020, an estimated 313,959 new cases occurred worldwide [2,3]. Most patients with EOC are diagnosed at advanced stage and experience disease recurrence despite extensive cytoreductive surgery and platinum-based chemotherapy. Approximately 70% to 80% of patients show initial response to platinum-based chemotherapy [4]. However, the median progression-free survival (PFS) in patients with advanced ovarian cancer is about 18 months, and recurrence occurs in more than 50% of patients within 2 years of completion of first-line therapy [5]. Due to the high recurrence rate, most patients are subject to repetitive treatment cycles and regimen changes [6].
Palliative chemotherapy is an important treatment option for patients with incurable advanced-stage cancer, and the rationale for treatment during disease progression has its pros and cons. The rationale for treatment would be to provide symptom palliation, maintain stable disease (SD), and for the opportunity to use newer agents with possibly fewer cumulative toxicities [7–9]. In fact, there has been an increase in the administration of palliative chemotherapy to patients with end-stage cancers due to the development of anticancer drugs that are highly effective and less toxic than conventional drugs [10]. In advanced non–small cell lung cancer (NSCLC), the development and availability of new chemotherapeutic agents has led to an increase in the number of lines of chemotherapy administered to patients, subsequently resulting in an increase in the length of time for patients to receive chemotherapy [11]. Similar treatment trends have been shown in gynecologic cancer patients [8]. However, repetitive administration of palliative chemotherapy may be harmful to patients’ quality of life depending on factors such as the timing of treatment, type of drugs administered, and toxicity [10]. Moreover, the delay in the referral to palliative care services can hinder adequate end-of-life treatment [12]. This leads to prolonged chemotherapy with lack of demonstrable benefits, low rates of hospice-care use, and increased interventions that result in emergency room (ER) visits, hospitalizations, or admissions to intensive care units (ICUs) at the end of life [10]. Therefore, timely discontinuation of chemotherapy and referral can lower healthcare costs and improve the quality of life of patients nearing the end of their lives [13].
However, it is difficult to estimate the survival duration of heavily treated recurrent ovarian cancer patients, and no indicator has been identified yet for the identification of those who may benefit from palliative chemotherapy [14]. Therefore, the objective of this study was to investigate the real-world survival outcomes in EOC patients who received third, fourth, and fifth-line chemotherapy due to disease progression. Furthermore, we aimed to identify patients who actually benefited from chemotherapy in regards to survival, so that we can select potential responders and preemptively avoid unnecessary chemotherapy administration and consider timely transfer to palliative and hospice care in poor responders at the end of life.
Materials and Methods
1. Study population
From the institution’s ovarian cancer cohort database, we identified the following patients: (1) those with EOC who had received cytoreductive surgery and platinum-based chemotherapy for first-line chemotherapy; and (2) those who completed third, fourth, or fifth-line chemotherapy between June 2008 and March 2021. We excluded the patients who had insufficient clinicopathologic data or lost to follow-up. The International Statistical Classification of Disease, 10th revision (ICD-10) code of EOC is C56.
2. Data collection
By reviewing patients’ medical records and pathologic reports, we collected clinicopathologic data such as age, serum cancer antigen 125 (CA-125) levels, International Federation of Gynecology and Obstetrics (FIGO) stage, histologic type and grade, extent of debulking surgery, and regimens and cycles of chemotherapy.
Patients were divided into the following three groups based on the latest line of chemotherapy that was administered during study period (to avoid duplicate patients): third-line, fourth-line, and fifth-line-chemotherapy groups. We compared the survival outcomes in these three groups. Further, depending on their treatment response, patients were defined as a good response group if their best overall response to treatment was complete response (CR), partial response (PR) or SD. Patients were categorized as a poor response group if the best overall response was progressive disease (PD) or if they expired before the treatment response assessment. Data on relevant factors related to survival outcomes and treatment-related adverse events were collected for these two groups of patients. The best overall response was defined as the best response recorded from the start of treatment until disease progression/recurrence. The final overall response was defined as the response recorded after the last dose of chemotherapy. Treatment-free interval (TFI) was defined as the time between the end of chemotherapy regimen and subsequent relapse. Chemotherapy regimens were decided by the gynecologic oncologists in consideration of the previous treatment regimens administered to the patients, the Korean National Health Insurance coverage, and adverse events that had previously occurred in patients.
3. Tumor assessment
PFS and overall survival (OS) were defined as the time to recurrence from the start of chemotherapy and the time from the start of chemotherapy until death, respectively. Disease control rate (DCR; percentage of patients who achieved CR, PR, or SD after receiving chemotherapy), and chemotherapy-induced toxicities were also evaluated. All patients underwent computed tomography (CT) scans every three cycles during chemotherapy. Tumor assessment was performed according to the Response Evaluation Criteria in Solid Tumors (ver. 1.1) using CT [15]. During the surveillance, CT scans were routinely performed every 3 to 4 months for the first 2 years, every 4 to 6 months for the next 2 years, and annually thereafter, or when symptoms or examination findings were suspicious for recurrence. Tumor markers were also used to evaluate treatment efficacy and response. Toxicity was evaluated according to the Common Terminology Criteria for Adverse Events (ver. 4.0) and classified as either hematologic or non-hematologic toxicity [16]. A serious adverse event (SAE) was defined as life-threatening event, persistent or significant disability, or hospitalization event during chemotherapy. The frequency of SAE was also documented.
4. Statistical analysis
Student’s t, Mann-Whitney U, and Kruskal-Wallis tests were used for analyzing continuous variables, and dichotomous variables were compared with the chi-square and Fisher exact tests. Categorical data were presented as number and percentage, and numerical data were presented as median and range or mean and standard deviation. Survival analyses were performed using the Kaplan-Meier method, and results were compared using the log-rank test and Cox proportional hazards regression models and calculated the adjusted hazard ratios and 95% confidence intervals (CIs). Associations between categorical variables and treatment responses to third, fourth, and fifth-line chemotherapy were evaluated using binary logistic regression analysis. Statistical analyses were performed using SPSS ver. 25.0 (IBM Corp., Armonk, NY). p-values < 0.05 were considered statistically significant.
Results
1. Patient characteristics and treatment response
A total of 189 consecutive patients who received third, fourth, or fifth-line chemotherapy during the study period were identified (S1 Fig.). Of them, 94 and 95 patients were categorized as good and poor response groups, respectively, based on their best overall response to treatment. There were no clinicopathologic differences between the two groups except for the histologic type, CA-125 level at the latest recurrence, TFI, and platinum sensitivity (Table 1). Median days from the last chemotherapy to death in the entire cohort was 108 days, with the median of 99 days (range, 6 to 1,181 days) in the poor response group. Baseline patient characteristics according to each line of chemotherapy and details on previous chemotherapy regimens are summarized in S2 Table and S3 Table. No significant differences were noted in clinical characteristics in patients who received third (n=41), fourth (n=54), or fifth-line (n=94) chemotherapy.
Chemotherapy responses after each line of chemotherapy are shown in S4 Table. Of the 189 patients, the treatment response of 167 patients was assessed since 22 patients expired before their treatment response could be assessed. The DCR among all patients was 49.7%; and there was no statistically significant difference among the third, fourth, and fifth-line chemotherapy groups (p=0.179). With respect to final overall response, the third-line chemotherapy group had the highest proportion of patients who achieved the objective response of CR, PR, or SD (31.7%) compared to later lines, with statistically significant differences among the three groups (p=0.031). The total number of patients who died before the completion of treatment was 27 (14.3%); without statistical difference among the three groups (p=0.070).
2. Comparison of survival outcomes
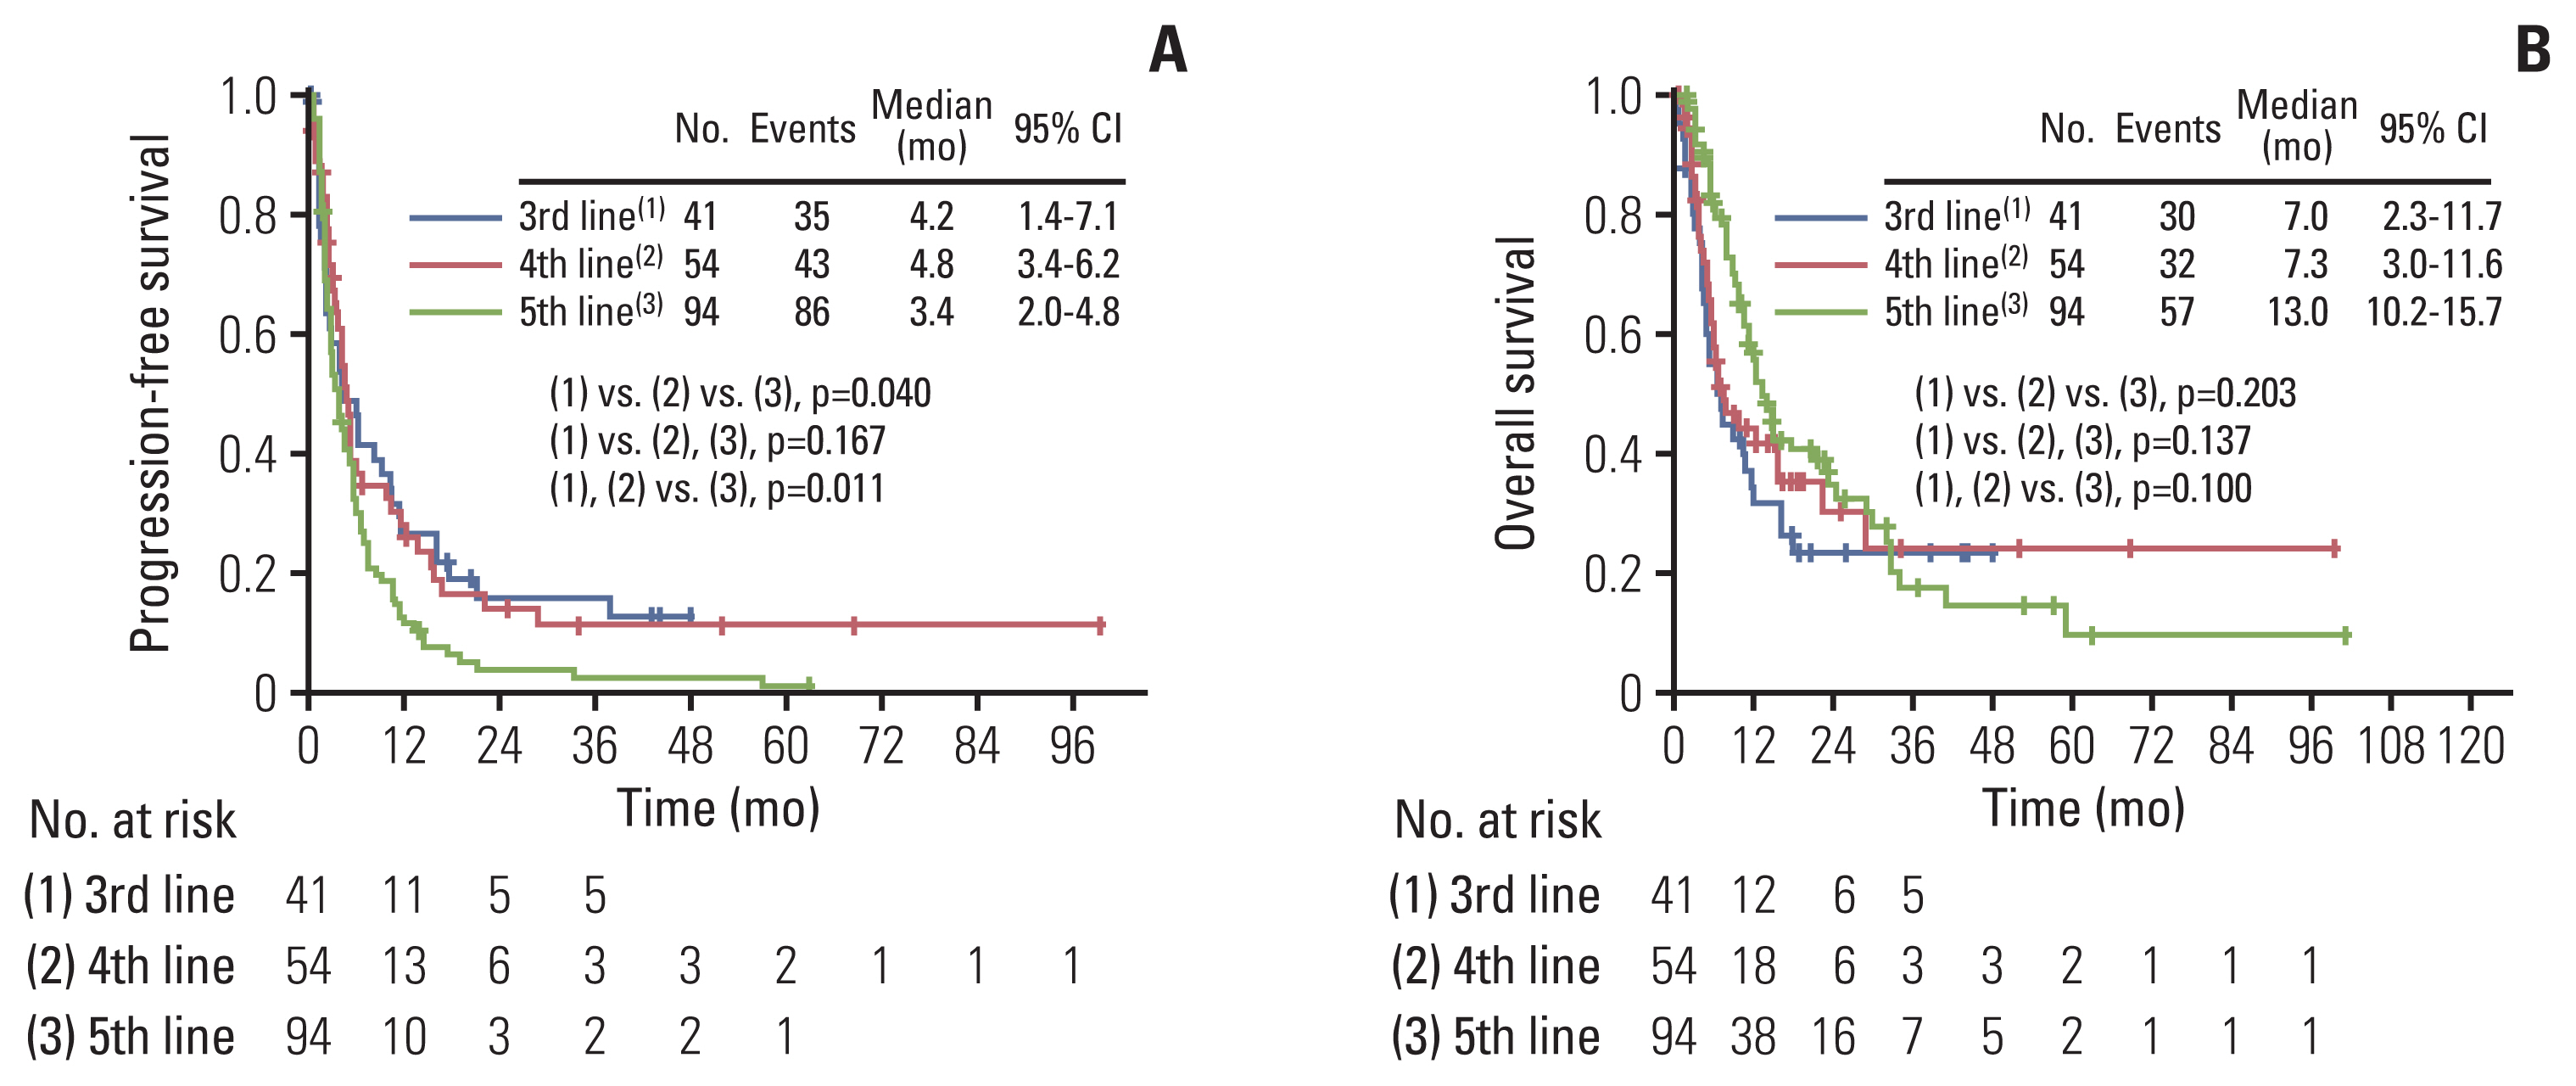
Median PFS in the third-line, fourth-line, and fifth-line chemotherapy groups was 4.2 months (range, 1.4 to 7.1 months), 4.8 months (range, 3.4 to 6.2 months), and 3.4 months (range, 2.0 to 4.8 months), respectively, with statistically significant differences among the three groups (p=0.040) (Fig. 1A). However, median OS in the third, fourth, and fifth-line chemotherapy groups was 7.0 months (range, 2.3 to 11.7 months), 7.3 months (range, 3.0 to 11.6 months), and 13.0 months (range, 10.2 to 15.7 months), respectively (Fig. 1B). There was no statistically significant difference among the three groups (p=0.203).
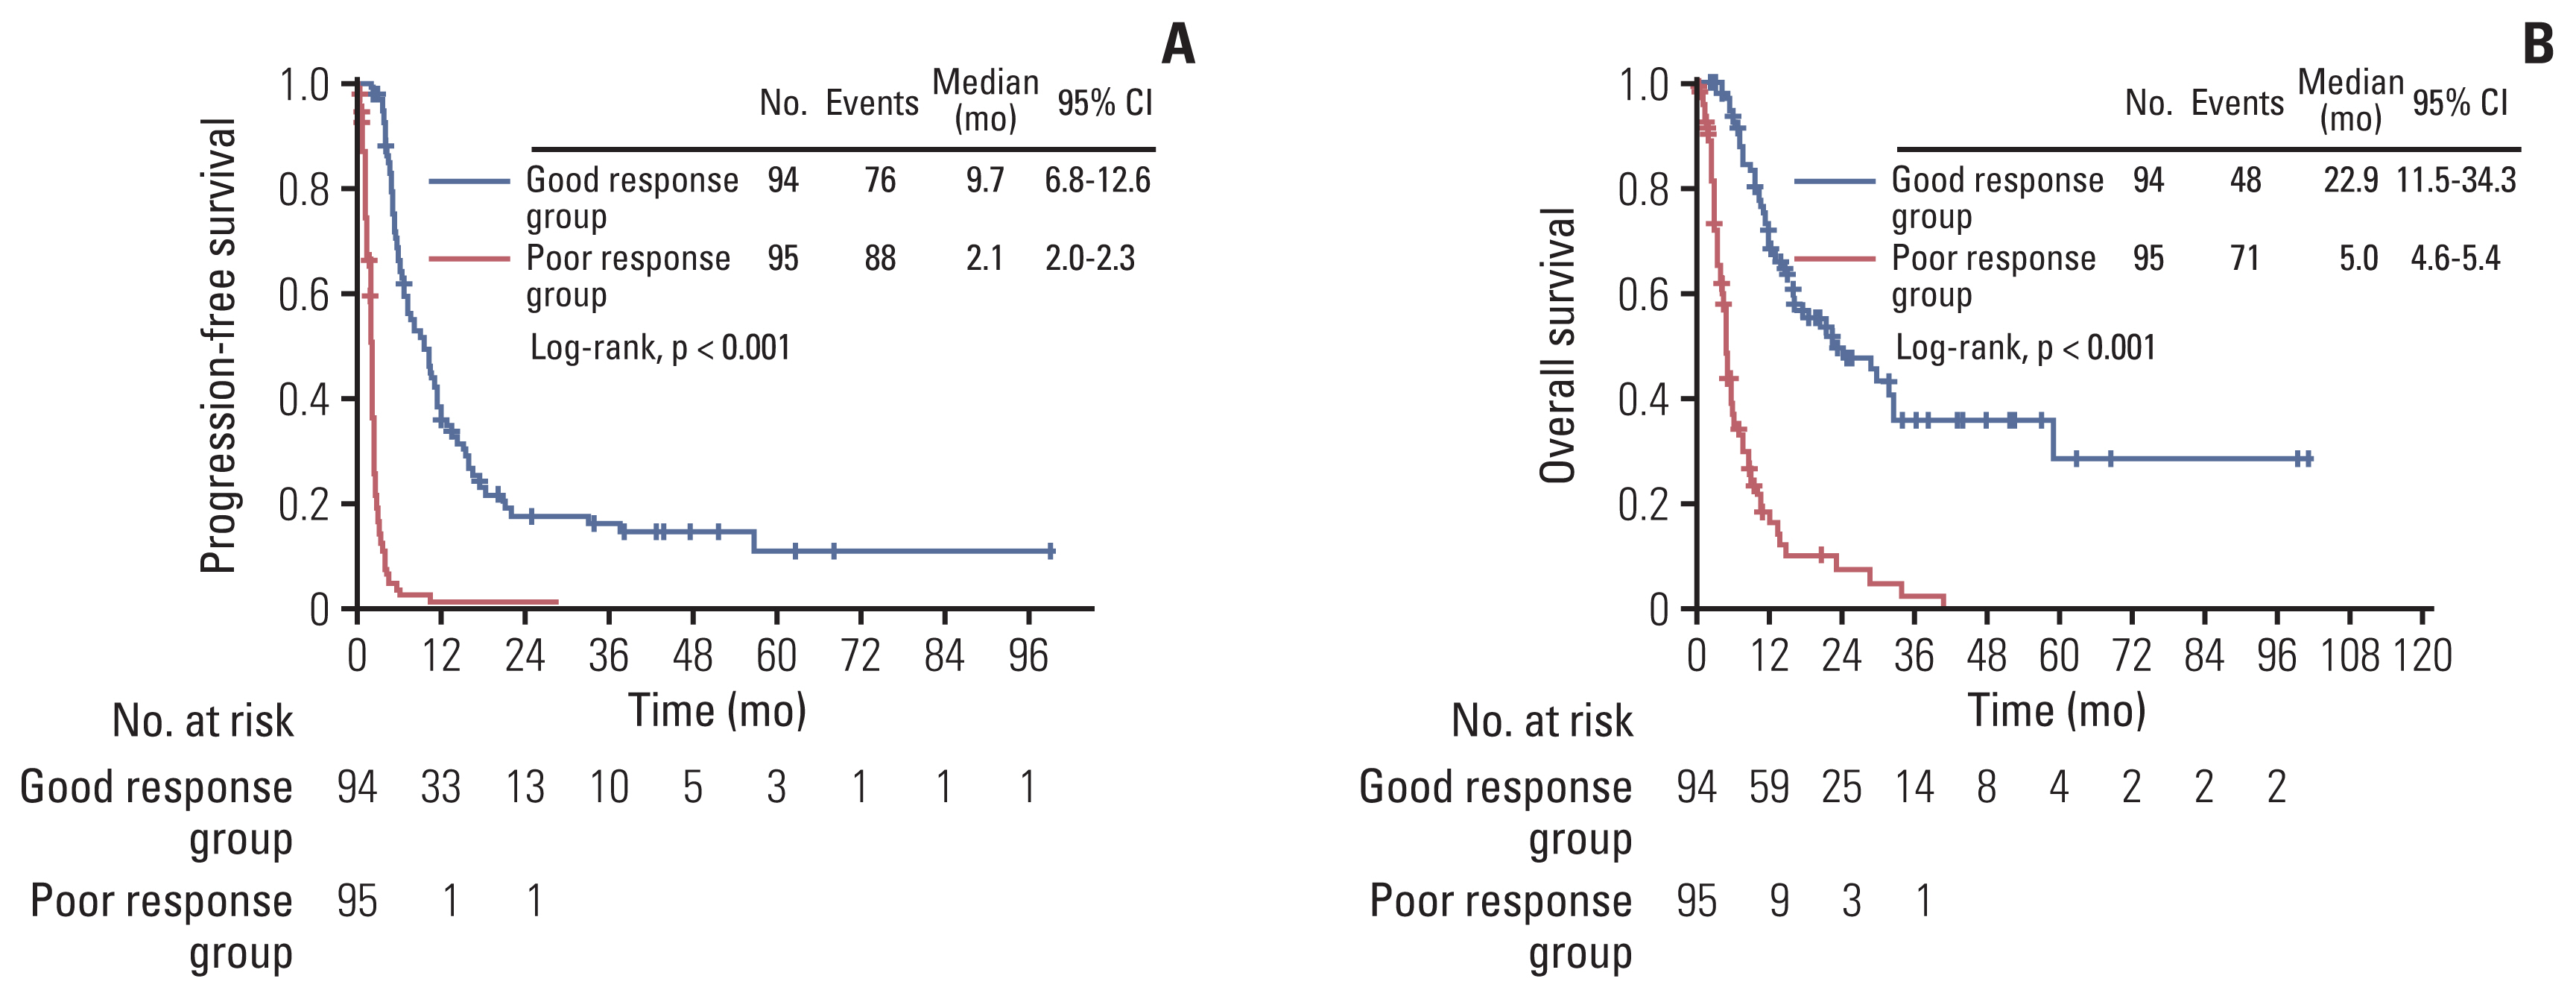
According to the treatment response, median PFS in the good response and poor response groups was 9.7 months (range, 6.8 to 12.6 months) and 2.1 months (range, 2.0 to 2.3 months), respectively (Fig. 2A), with significantly higher response in the good response group (p < 0.001). The OS in the good response group was also longer than the poor response group, with the median OS of 22.9 months (range, 11.5 to 34.3 months) and 5.0 months (range, 4.6 to 5.4 months), respectively (p < 0.001) (Fig. 2B).
Multivariate analysis adjusted for age at recurrence, histologic type, FIGO stage, previous TFI, CA-125 at recurrence, residual tumor after debulking surgery, line of chemotherapy, malignant ascites, malignant pleural effusion, distant metastasis, and platinum sensitivity revealed that PFS in the good response group was significantly better than that in the poor response group (hazard ratio [HR], 8.472; 95% CI, 5.232 to 13.720) (Table 2). Similarly, OS in the good response group was significantly better than that in the poor response group (HR, 4.202; 95% CI, 2.599 to 6.792).
3. Predictive factors for poor responses
Univariate analyses revealed that poor responses occurred significantly more commonly among patients with higher CA-125 at recurrence (> 500 IU/mL, p=0.008), shorter TFIs (≤ 3 months, p < 0.001), platinum-resistant EOC (p=0.001), or non-serous/endometrioid (non-S/E) EOC (p=0.016). In multivariate analysis, we found that short TFIs, platinum-resistant EOC, and non-serous and non-endometrioid EOC were independent risk factors of poor response (Table 3).
4. Adverse events
With respect to the incidence of SAEs, there was no statistically significant difference between the good and poor response groups (p=0.167) (Table 4). Compared to the proportion of patients in the poor response group in whom neutropenic events of grade ≥3 occurred (15.8%), that in the good-response group was significantly higher (38.3%) (p < 0.001). The proportion of patients who were admitted through the ER due to treatment-related conditions was significantly greater (27.4%) in the poor response group than the good response group (13.8%, p=0.030). A detailed comparison of the two groups with respect to SAEs is shown in Table 4.
5. Subgroup analysis
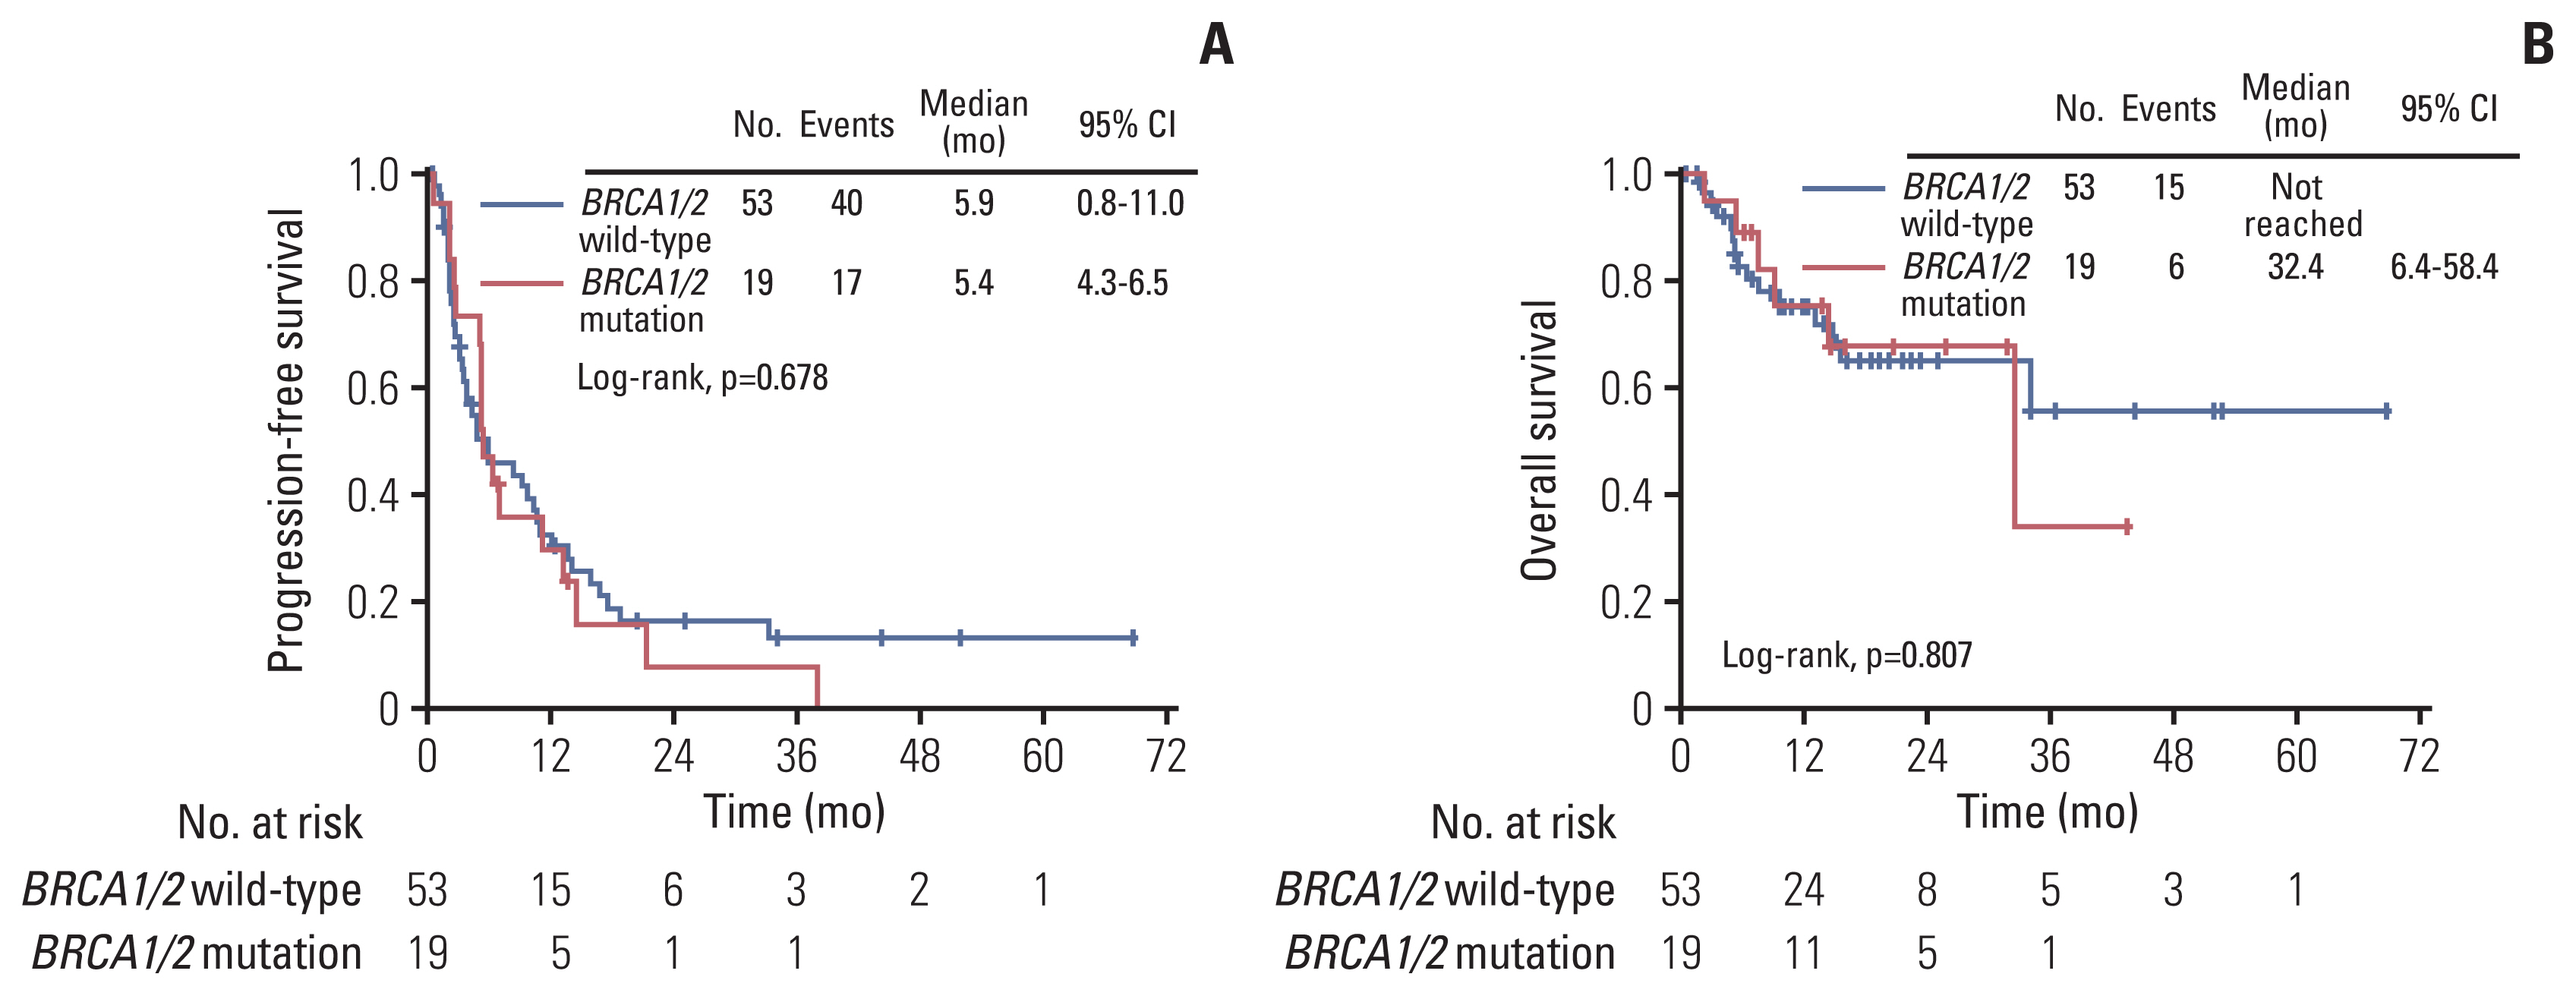
A total of 72 patients among all patients underwent somatic or germline BRCA test. There was no significant difference in PFS and OS according to the BRCA mutation. A detailed comparison of BRCA mutation group and BRCA wild-type group is shown in Fig. 3.
Discussion
In this study, the median PFS in the good and the poor response groups receiving three or more lines of chemotherapy for recurrent EOC was 9.7 and 2.1 months, respectively. Platinum sensitivity, longer TFI following the last chemotherapy regimen, and endometrioid/serous histology were revealed as independent factors for survival benefit after third and subsequent lines of chemotherapy.
The decision making on whether to continue with palliative chemotherapy in heavily treated ovarian cancer patients is difficult and requires careful consideration. In a study conducted in Italy, 66% of patients with NSCLC, breast, colorectal, and gastric cancer received chemotherapy during the last 3 months of their lives, and 33% of them received anticancer treatment during the last month of life [17]. In a recent study of gynecologic cancer patients who died between 2006 and 2010 after receiving palliative chemotherapy without hospice care, the mean frequency of palliative chemotherapy during the last 6 months of life was 3.84 times, which increased to 4.93 times between 2011 and 2015 [8]. The National Comprehensive Cancer Network guidelines recommend that patients should be referred to palliative care specialist and consider hospice care if there is evidence of worsening prognosis, including the decline in performance status to 3 or worse, or uncontrolled symptoms and distress despite anticancer therapy [18]. This is based on previous studies that showed the positive effect of early referrals (> 3 months before the occurrence of death) to palliative care services on fewer ER visits, decreased number of hospitalizations, and admissions to ICUs [19]. Nevertheless, the guidelines are not fully met in the real-world clinical practice due to the lack of data on survival outcomes of heavily treated patients and difficulty in predicting prognosis. In our study, the median time from the last chemotherapy to death was 108 days, with the shortest interval of 6 days, which suggests the need for continuous patient assessment for timely referral to end-of-life care.
Studies have been conducted to assess the survival benefit and response rates after multiple lines of chemotherapy in order to decide the timing of chemotherapy discontinuation and transition to hospice care [20]. In NSCLC patients on second-line chemotherapy, the survival improvement has been reported to be about 2 months [21]. In contrast, the response rate of third or fourth-line chemotherapy was only 0%–2% [22]. In this case, cytotoxic therapy would not be useful unless it is used for exceptionally emergent purposes. However, studies are lacking in regard to the specific criteria for palliative care referral in gynecologic oncologic patients or survival data of recurrent EOC after 2nd line therapy. In a retrospective study of platinum-resistant/refractory EOC patients, 60.2%, 27.0%, and 7.7% of patients were platinum-resistant after the first, second, and third-line chemotherapy, respectively [23]. The overall response rate was 30.6%, and the median progression-free interval (PFI) and OS was 16 and 48 weeks in patients with second-line chemotherapy after onset of platinum resistance [23]. In our study, the overall response rate was higher (49.7%) and the PFI was also longer with the median PFS of 4.2 months after third-line chemotherapy. Higher proportion of platinum-sensitive relapse patients (66.7%) included in our study may explain the difference in outcomes. Regarding treatment response, it is noteworthy that more than half of patients experienced PD in each chemotherapy lines, and less than 30% showed stable disease or higher. Expectedly, the rate of PD was the highest in the fifth-line chemotherapy group.
There are several prognostic tools to predict life expectancy in cancer patients. Among them, Palliative Prognostic Index is used as a useful prognosticator of life expectancy to distinguish patients who require palliative care referral [24]. The accuracy of prognostication can be further improved by the concurrent use of the Glasgow Prognostic Score and the Carlson Comorbidity Index [25]. These scales commonly use patients’ performance status in addition to symptoms and/or serum markers. Although the patient’s general performance status is crucial for successful maintenance of chemotherapy, recent evidence showed that chemotherapy use among chemotherapy-refractory metastatic cancer patients did not provide benefit to survival nor quality of life in the final week of life. Moreover, chemotherapy appeared to be most harmful to those patients with good performance status [26]. In this study, we aimed to distinguish good response group from the poor from a retrospective database, so that patients with poor response could preemptively avoid unnecessary exhaustive treatments. The ‘good response’ group was categorized according to the best objective response of SD or higher after the third and subsequent lines chemotherapy. These patients had serous and endometrioid histology, lower CA-125 level at recurrence, longer TFI, and initial platinum sensitivity. This finding is consistent with other studies, one of them being a nomogram study to predict survival after recurrence in patients with recurrent ovarian cancer [27]. In their study, the time to recurrence showed strong significance in the nomogram for predicting survival (adequacy index=0.85). The median OS in patients with time to recurrence less than 6 months was 9.8 months and those longer than 36 months was 44.8 months (log-rank test p < 0.001). In terms of overall survival, residual disease, stage, histology, and age have been suggested as relevant factors [27]. In our cohort, residual disease, stage, and age were not significant factors for survival and this difference may lie in the pretreatment history, since the studied patients in our cohort were heavily treated patients of more than three lines of chemotherapy. The risk factors for poor response were short TFI less than 3 months, non-serous/endometrioid histology, and platinum resistance. Although platinum sensitivity is known as one of the most important prognostic factors in recurrent ovarian cancer, further research on individual biomarkers of platinum resistance is needed since majority of patients become platinum-resistant with subsequent relapses.
In recurrent ovarian cancer treatment, toxicity and quality of life should always be weighed together with the benefit from the cytotoxic therapy. Adverse events that lead to ER visits, hospital death, ICU admissions, and long hospital stays contribute to a poor quality of life near the end of life [28,29]. In our study, the rate of SAE was 50% in the good response group and 40 percent in the poor response group, without statistical significance. Non-hematologic SAE and ER visits and were significantly higher in the poor response group, although the proportion of patients with grade 3 or higher neutropenia was more frequently observed in the good response group. Despite being a frequent adverse effect of chemotherapy, there are some reports on the role of chemotherapy-induced neutropenia (CIN) as a favorable prognostic marker in different malignancies such as breast, gastric, non-small cell lung, and pancreatic cancer [30]. However, the timing of CIN onset and its effect in heavily treated patients may be different from the existing studies which mostly addressed early onset or CIN development during primary treatment. Nevertheless, active supportive management with granulocyte-stimulating factors in high-risk patients may be beneficial, especially in those with good treatment response.
The limitation of this study is its retrospective design; furthermore, only patients treated at a single institution were included in this study which results may not be suitable for generalization. Also, quality of life analysis was not performed, which is one of the markers to determine the continuation or cessation of treatment, especially for patients with PD. In addition, only 38 percent of patients in this cohort had been tested for BRCA mutation and therefore could not be adequately assessed whether BRCA contributes to treatment response in heavily treated patients. The role of genetic and molecular markers in regard to palliative care may be an important area of study in the coming years, especially in the recent era of immuno-oncology. The strength of this study is the comprehensive data on the chemotherapeutic agents used and toxicities including severe adverse events, which will provide insights to the outcomes of conventional cytotoxic treatment. Also, this is one of very few studies to report factors associated with good treatment responses in patients with EOC who received three or more line of chemotherapy. Therefore, we believe that the response rates shown at later lines of chemotherapy in this study may contribute as baseline information when counseling patients with palliative treatment options.
In conclusion, recurrent EOC patients with initial platinum sensitivity, longer treatment-free intervals, and endometrioid and serous histology are associated with good responses to third and subsequent lines of chemotherapy. Continuation of treatment beyond third line should be carefully considered in selected patients for palliative purposes, with timely discussions on goal-directed care.