Introduction
Hepatocellular carcinoma (HCC) still remains one of the most prevalent malignancies [1,2], ranking the third causes of cancer-related death worldwide [3]. The morbidity and mortality of HCC are particularly higher in Asian countries due to more frequent hepatitis B virus and hepatitis C virus infection [4]. Although surgery, liver transplantation, and radiofrequency ablation have been adopted as curative treatments [5], they are barely available to a considerable portion of HCC patients who are frequently diagnosed in advancedstage [6]. Therefore, it is significantly important to elucidate the molecular mechanism involved in HCC progression, shedding light on new therapeutic targets for HCC patients.
Cathepsins (CTS) are classified into cysteine (B, C, F, H, L, K, O, S, V, and W), serine (A and G) and aspartic proteases (D and E) based on the amino acids related with the catalytic process [7]. CTSs are activated by proteolytic cleavage or other proteases after synthesized as inactivated precursors, and CTS has been proved to be versatile in different tissues [8]. It was well accepted that cathepsin B (CTSB) and cathepsin S (CTSS), belonging to the cysteine category, had the capabilities of promoting HCC progression. For instance, a valid correlation was observed between the aberrant expression of CTSB and poor prognosis of HCC patients [9]. Lee et al. [10] verified that CD47 drove tumor initiation, self-renewal, chemoresistance, invasiveness through up-regulation of CTSS.
Cathepsin C (CTSC), known as dipeptidyl peptidase I, is a lysosomal cysteine protease belonging to the papain superfamily. It is ubiquitously expressed in many tissues, which implies an indispensable role in biological process. It has been observed that CTSC was upregulated in various malignancies including squamous, pancreatic and breast cancer [11-13]. Moreover, Khaket et al. [14] revealed that CTSC mediated colorectal cancer cell proliferation by regulating autophagy. Mikhaylov et al. [15] observed reduced keratinocyte proliferation and vascularization in CTSC-deficient mice during squamous cell carcinogenesis. Thus, it was reasonable to consider that CTSC was a putative oncogene.
Given that the biological function of CTSC in HCC remains obscure, in the present study, we first investigated the differential expression of CTSC in HCC and normal liver tissues and further analyzed the correlation between the expression of CTSC and clinicopathological characteristics. Subsequently, by lentiviral-vector-mediated ectopic expression and siRNA-mediated knockdown of CTSC, we demonstrated that CTSC promoted proliferation and metastasis of HCC. Taking advantage of the public database, we figured out that CTSC was involved in tumor necrosis factor α (TNF-α)/ MAPK (p38) pathway in HCC cell lines. Further, we raised that there may exist a positive feedback loop between CTSC and TNF-α/MAPK (p38) pathway. Collectively, our study indicates that CTSC plays an oncogenetic role in HCC and may be employed as a potential treatment target for HCC patients.
Materials and Methods
1. Cell lines and cell culture
The human liver cancer cell lines SK-HEP-1, SMMC-7721, HepG2, MHCC-97H, Hep3B, and PLC/PRF/5 were obtained from the Cell Bank of Shanghai Biology Institute, Chinese Academy of Science (Shanghai, China), which were all proved to be free from mycoplasma contamination and were authenticated by short tandem repeat analysis. Cells were cultured in Dulbecco’s modified Eagle’s medium (DMEM; Gibco, Gaithersburg, MD) supplemented with 10% fetal bovine serum (FBS; Gibco), 100 μg/mL streptomycin and 100 U/mL penicillin (Gibco), in a humidified 5% CO2 atmosphere at 37°C. Recombinant human TNF-α was purchased from Novoprotein (Suzhou, China), and further diluted with sterile water into various concentration. Ralimetinib (p38 specific inhibitor) was purchased from Selleck. Cells assays were performed after incubated with TNF-α or Ralimetinib for 48 hours.
2. Patients and tissue microarrays
Six slides of tissue microarrays containing a cohort of 122 paraffin-embedded HCC specimens were obtained from The First Affiliated Hospital of Sun Yat-sen University. The patients were diagnosed as HCC between January 2006 and December 2008. The detailed parameters are as following: age, sex, hepatitis B surface antigen, cirrhosis, ascites, α-fetoprotein (AFP), tumor size, tumor number, tumor capsule, portal vein tumor thrombus, and tumor differentiation. The mean age of patients was 50 years old (range, 22 to 79 years), the medium follow-up time was 25 months (range, 3 to 81 months).
3. Immunohistochemistry and scoring
Six slides of tissue microarrays were first baked at 60°C for 3 hours, followed by dewaxing with xylene, graded alcohols, hydrated, and washed in phosphate-buffered saline (PBS). Slides were then submerged in sodium citrate antigen retrieval buffer in a microwave oven. The endogenous peroxidase was inhibited with 3% hydrogen peroxide for 10 minutes, then specimens were blocked with 20% goat serum and 0.25% TritonX-100 in PBS. Subsequently, slides were incubated with CTSC (1:400 in PBS with 5% goat serum, A8403, ABclonal, Wuhan, China) overnight in a moist chamber at 4°C, then washed in PBS, and incubated with biotinylated goat anti-rabbit antibody (DAKO, Waldbronn, Germany) at room temperature for 30 minutes. After washed in PBS, slides were developed with 3′,3-diaminobenzidine tetrahydrochloride (DAKO), counterstained with hematoxylin. For CTSC assessment, the percentage of positively stained cells was scored as 0, negative; 1, less than 25%; 2, 26%-50%; 3, 50%-75%; 4, greater than 75% while intensity was scored as 0, negative; 1, weak; 2, moderate; and 3, strong. The aggregate score of each slide was calculated by the sum of percentage and intensity score. For each case, the scores were independently determined by two pathologists. The immunohistochemistry (IHC) medium score of CTSC was 3.5, the score ≤ 3.5 was identified as low expression group, > 3.5 as high expression group.
4. Interference of CTSC expression in HCC cell lines
To obtain cell lines stably overexpressing CTSC, SK-HEP1, and SMMC-7721 cells were both infected with the lentiviral Lv-CTSC vector (Lv-CTSC) and Lv-control vector (Vec) (Viewsolid Biotech, Beijing, China). To perform transient silence of CTSC, two different sequences of small interfering RNA (siRNA) targeting human CTSC mRNA were synthesized by Viewsolid Biotech, siRNA-1 for GCAGCAAGGUGACCACUUATT (5′-3′), siRNA-2 for GCUACUCAUUUGCUUCUAUTT (5′-3′). A non-specific mock siRNA (Mock) sequence was used as the negative control. We used siRNA and Lipofectamine 3000 (Thermo Fisher Scientific, Rockford, IL) to transiently transfect into SK-HEP-1 and PLC/PRF/5 cells. All functional assays were performed 48 hours after transfection with siRNA.
5. Quantitative real-time PCR
The total RNA was extracted from HCC cells using RaPure Total RNA Kit (Magen, Guangzhou, China). Then, complementary DNA was synthesized using the PrimeScript RT reagent Kit (Takara, Kusatsu, Japan). Quantitative real-time polymerase chain reaction (qRT-PCR) was performed with SYBR Premix ExTaq (Takara) on a LightCycler (Roche, Indianapolis, IN). Conditions for reverse transcription polymerase chain reaction were 30 seconds at 95°C and followed by 40 cycles of 95°C for 5 seconds. The primers were as following: CTSC, forward: 5′-CCAACTGCACCTATCTTGACC-3′ and reverse: 5′-AAGGCAAACCACTTGTAGTCATT-3′; glyceraldehyde 3-phosphate dehydrogenase (GAPDH), forward: 5′-ACAACTTTGGTATCGTGGAAGG-3′ and reverse: 5′-GCCATCACGCCACAGTTTC-3′; TNF-α, forward: 5′-GAGGCCAAGCCCTGGTATG-3′ and reverse: 5′-CGGGCCGATTGATCTCAGC-3′. GAPDH was used as an internal control for semi-quantitation. All qRT-PCR experiments were performed in triplicate.
6. Western blot assay
Proteins were extracted from HCC cell lines with various treatments, followed by fractionation by sodium dodecyl sulfate polyacrylamide gel electrophoresis, transferring to polyvinylidene difluoride membrane. The membrane was blocked with 5% nonfat milk in Tris-buffered saline Tween20 (TBST) for 1 hour at room temperature, then incubated with a primary specific antibody against CTSC (1:1,000, A8403, ABclonal, Wuhan, China), GAPDH (1:4,000, bs-2188-R, Bioss, Woburn, MA), p-p38 (1:1,000, AP0297, ABclonal), p38 (1:1,000, A14401, ABclonal), matrix metalloproteinase (MMP)-3 (1:1,000, #14351, Cell Signaling Technology, Danvers, MA), MMP-9 (1:1,000, #13667, Cell Signaling Technology), and vimentin (1:1,000, #5741, Cell Signaling Technology) at 4°C overnight. After washed in TBST, the membrane was incubated with horseradish peroxidase–conjugated antirabbit second antibody (1:4,000) at room temperature for 1.5 hours. Pierce ECL (Thermo Fisher Scientific) was used to expose the band.
7. Cell Counting Kit-8 assay
Cell proliferation was examined by the Cell Counting Kit8 (CCK-8) assay (Dojindo Lab, Kumamoto, Japan). Briefly, SK-HEP-1 and SMMC-7721 cells infected with Lv-CTSC and Vec, SK-HEP-1, and PLC/PRF/5 cells transfected with siRNA-1, siRNA-2, and mock were seeded onto 96-well plates. At the indicated time-point, 10% CCK-8 solution in DMEM was added to each well and incubated for 2 hours. The optical density values of each well were measured at 450 nm by a microplate reader. All experiments were repeated at three times.
8. Colony formation
Cells with stably overexpressing CTSC and cells with transient knockdown of CTSC were detached in the quantity of 500, and seeded in 6-well plates, then cultured at 37°C for 14 days. Colonies were fixed with 4% paraformaldehyde and stained with 0.5% crystal violet in methanol and counted.
9. Animals and treatment
The female BALB/c nude mice (4 weeks old) were purchased from Nanjing Biomedical Institute of Nanjing University, bred in a specific pathogen-free facility. For tumor growth assays in vivo, the number of 5×10⁷ SMMC-7721 cells stably transfected with Lv-CTSC or Vec in 100 μL DMEM medium was subcutaneously injected into the right-back of 10 nude mice. All mice were euthanized 6 weeks later. Tumor volumes were calculated by length×width2×0.5 after detachment. Subsequently, the mean tumor volume for each group was measured. The animal study was performed in a randomized manner.
10. Cell migration and invasion assays
Quantitative cell migration and invasion assays were performed using 24-well Boyden chambers (Corning, New York, NY). For the migration assay, cells with stably overexpressing CTSC and cells with transient knockdown of CTSC were detached in the quantity of 5×10⁴ and seeded into the upper well of the Boyden chambers with 200 μL 1% FBS in DMEM, and with 700 μL 15% FBS in DMEM added to the lower chamber. Cells on the upper surface of the filter were removed after 24 hours of incubation for SK-HEP-1, 72 hours for SMMC-7721 and PLC/PRF/5. The residual cells were fixed in 4% paraformaldehyde and stained with 0.5% crystal violet after washed in PBS. The migrated cells were photographed under a Leica inverted microscope and quantified. For the invasion assay, the surface of the upper well was covered with 10 mg/mL Matrigel (BD Biosciences, Rockville, MD). The rest procedure of the invasion assay was performed as previously described.
11. The bioinformatic web tools
The Gene Expression Profiling Interactive Analysis (GEPIA, http://gepia.cancerpku.cn/index.html/) is an online database, the RNA sequencing information of which originates from The Cancer Genome Atlas (TCGA) and the Genotype-Tissue Expression (GTEx) projects. The GEPIA was used to perform survival analysis and a pairwise gene correlation. The Cancer Cell Line Encyclopedia (CCLE) was used to analyze the expression of CTSC in various tumor cell lines. The cBioPortal for cancer genomics (http://www.cbioportal.org/) was used to reveal the co-expression gene set related to CTSC; the RNA sequencing expression data was based on TCGA. To obtain insight into biological pathways in which CTSC got involved, the previous co-expression gene set related to CTSC was used to performed Gene Set Enrichment Analysis (GSEA) via DAVID 6.8 web tool (https://david.ncifcrf.gov/). GeneCards website (http://www.genecards.org/) and Cistrome Data Browser (http://cistrome.org/db/#/) were methods to predict the transcript factor (TF) of CTSC gene promoter. Kyoto Encyclopedia of Genes and Genomes (KEGG, https://www.genome.jp/kegg/) was used for pathways inquiry.
12. Statistical analysis
SPSS ver. 24.0 software (IBM Corp., Armonk, NY) and GraphPad Prism 8 software (GraphPad Software, Inc., La Jolla, CA) were used to calculate statistical significance with Student t test (2-tailed) for single comparisons and one-way ANOVA for multiple comparisons of continuous variables. The chi-square test was applied to the examination of the relationship between CTSC expression and clinicopathological characteristics. Survival curves were plotted by the Kaplan-Meier method and log-rank test. Cox regression model in the multivariate analysis was used to analyze the significance of various overall survival (OS)–related variables. Statistical significance was identified as p < 0.05.
13. Ethical statement
This study was approved by The Ethic Committee of The First Affiliated Hospital of Sun Yat-sen University. As to the informed consents for the medical research, all patients provided the medical records of information about specimens.
The animal research was approved by the Animal Ethic Committee of The First Affiliated Hospital of Sun Yat-sen University following the Reporting of In Vivo Experiments (ARRIVE) guidelines drafted by the National Centre for the Replacement, Refinement and Reduction of Animals in Research (NC3Rs).
Results
1. CTSC is frequently upregulated in HCC and correlated with poor prognosis of HCC patients
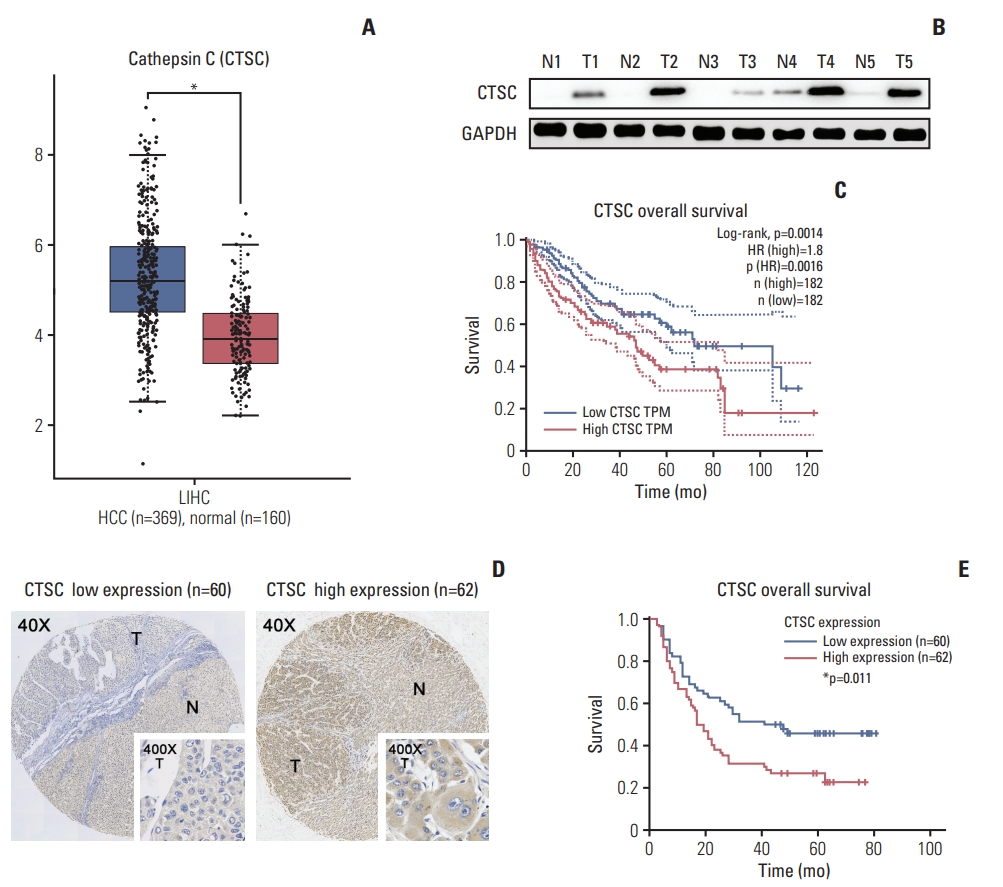
To explore the expression of CTSC in HCC, we firstly adopted GEPIA web tool to perform data pooling from TCGA and the GTEx database and found that the mRNA level of CTSC was significantly higher in HCC (n=369) than normal liver tissues (n=160) (Fig. 1A). Then western blot assay was performed to verify the previous result in 20 pairs of HCC and adjacent normal tissues (Fig. 1B). The result showed that CTSC was in higher expression compared to the adjacent normal tissues. Survival analysis revealed CTSC as a negative survival indicator in HCC, high expression of CTSC was associated with a poor OS rate for HCC patients from GEPIA database (Fig. 1C).
To validate the correlation between CTSC and prognosis, which has been found in the external database, we conducted IHC staining upon HCC tissue microarrays (n=122) and verified that CTSC was differentially expressed in HCC specimens (Fig. 1D). Fifty point eight percentage (62/122) HCC samples in our cohort displayed high expression. We investigated the correlation between CTSC expression and HCC patients’ clinicopathologic characteristics. The results showed that high expression of CTSC was significantly correlated with cirrhosis (p=0.039), ascites (p=0.009), and high AFP level (p=0.005) (Table 1). Survival analysis indicated that patients with high CTSC expression had poorer OS than those with low CTSC expression (p=0.011) (Fig. 1E). Multivariate Cox analysis showed CTSC expression was one of the independent prognostic factors for HCC (hazard ratio, 2.402; 95% confidence interval, 1.493 to 3.865; p < 0.001) (Table 2).
2. CTSC promotes HCC cells proliferation, migration, and invasion
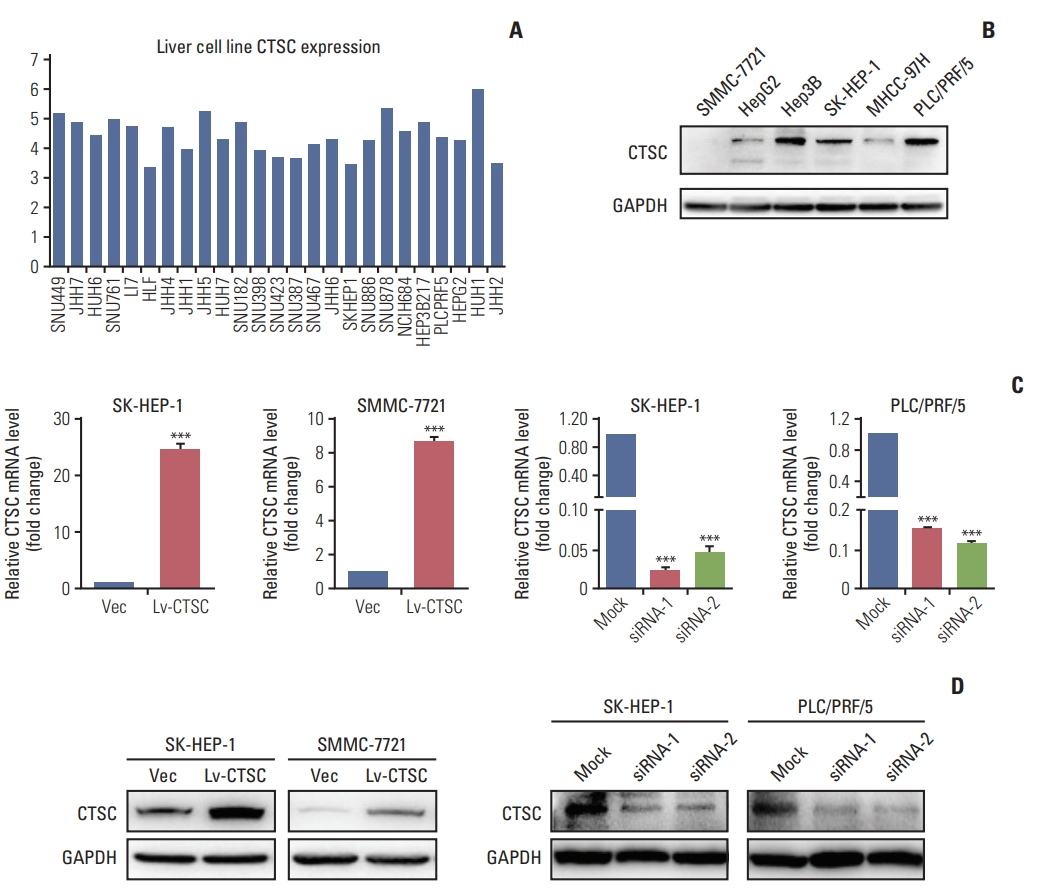
To elucidate the function of CTSC in HCC, we first demonstrated that CTSC was generally expressed in HCC cell lines through the CCLE (Fig. 2A) and verified the differential protein expression in six HCC cell lines (Fig. 2B). The western blot assay indicated that CTSC was low-expressed in SMMC7721, HepG2, and MHCC-97H cells, moderate-expressed in SK-HEP-1 cells, high-expressed in Hep3B and PLC/PRF/5 cells. Then, the lentiviral Lv-CTSC vector was designed to stably overexpress CTSC in SK-HEP-1 and SMMC-7721 cells, and the CTSC siRNA was developed to transiently silence CTSC in SK-HEP-1 and PLC/PRF/5 cells. The ectopic expression or silence effect of CTSC were validated by qRT-PCR and western blot assay (Fig. 2C and D).
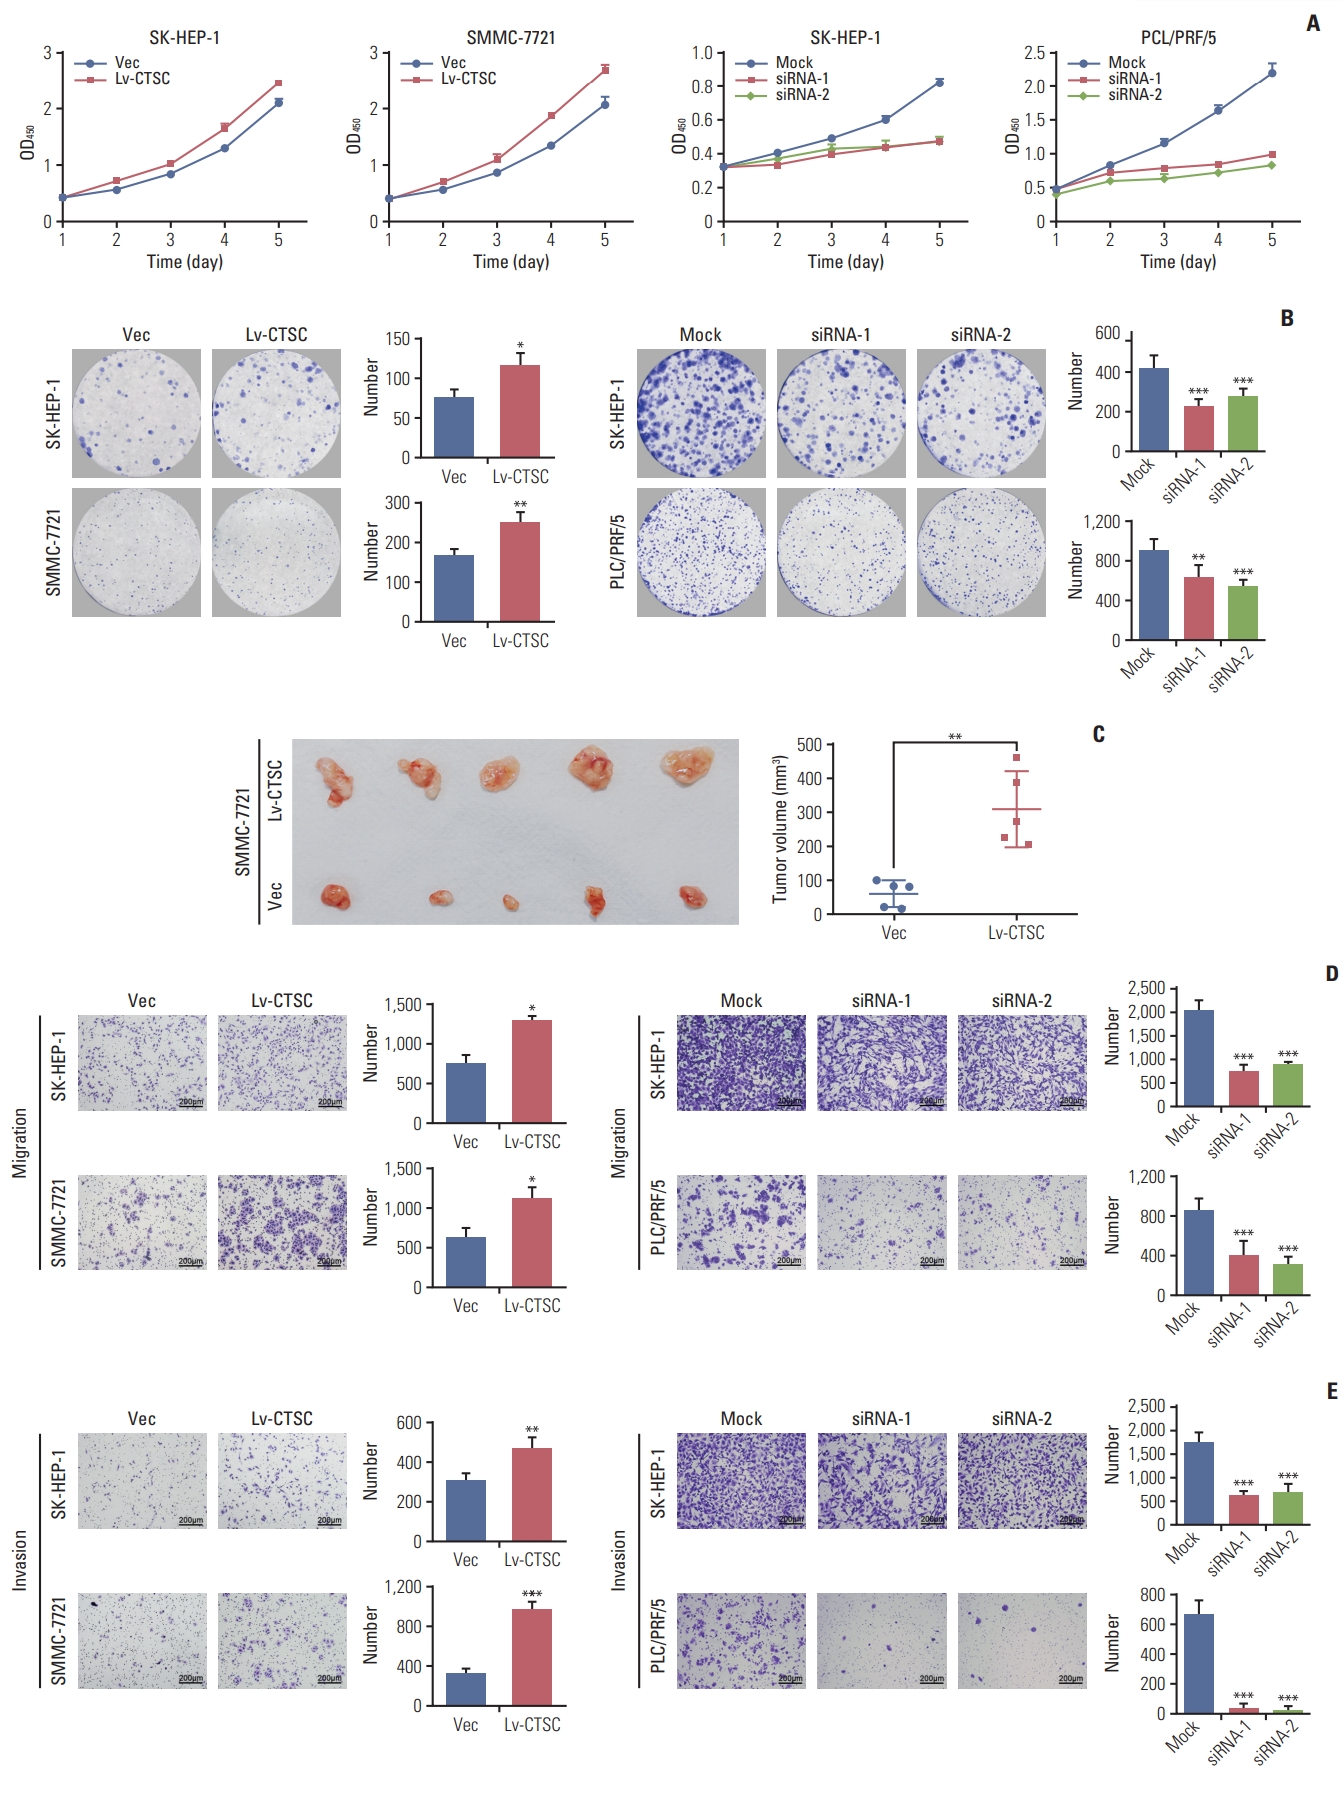
To explore the proliferative function of CTSC in HCC, CCK-8 assay was performed. It showed that overexpression of CTSC enhanced the proliferation in both SK-HEP-1 and SMMC-7721 cells, whereas the depletion of CTSC attenuated this effect in both SK-HEP-1 and PLC/PRF/5 cells (Fig. 3A). The effect of CTSC on viability was further verified in colony formation assays. Cells overexpressing CTSC formed more colonies than those with Vec-control. Accordingly, the silence of CTSC generated less colonies in comparison with the mock group (Fig. 3B).
To determine the role of CTSC on tumor growth in vivo, SMMC-7721 cells stably transfected with lentiviral Lv-CTSC vector or Vec-control were subcutaneously injected into the right flank of nude mice for xenograft. The subcutaneous tumors from SMMC-7721 cells overexpressing CTSC presented greater mean volumes than those from cells with Veccontrol (Fig. 3C).
To explore whether CTSC regulates HCC cell migration and invasion, trans-well chamber and Boyden Chamber assays were applied respectively. Trans-well chamber assays indicated that overexpression of CTSC enhanced migratory capability in both SK-HEP-1 and SMMC-7721 cells, while the knockdown of CTSC impaired the migration potential of both SK-HEP-1 and PLC/PRF/5 cells (Fig. 3D). Boyden chamber assays showed that overexpression of CTSC increased the invasivenss of both SK-HEP-1 and SMMC-7721 cells, whereas the knockdown of CTSC exerted opposite effects (Fig. 3E). Collectively, CTSC promoted the migration and invasion of HCC cells in vitro.
3. TNF-α/p38 MAPK pathway is involved in CTSC mediated HCC progression
To elucidate the mechanism in which CTSC was involved, the genes co-expressed with CTSC in HCC was pooled via the cBioPortal web tool. Genes with correlation coefficient score greater than 0.3 were selected to perform GSEA to obtain the CTSC-related pathways by the DAVID 6.8 web tool (Fig. 4A). We then examined the expression of the key regulators in those pathways picked by DAVID. Our results found that overexpression of CTSC activated the TNF-α/ p38 MAPK pathway but not the others in both SK-HEP-1 and SMMC-7721 cells (Fig. 4B). Accordingly, MMP-3, MMP-9, vimentin, and TNF-α, which were the downstream molecules of TNF-α/p38 MAPK pathway and positively regulate the proliferation and metastasis of HCC, were significantly upregulated by the overexpression of CTSC in both SK-HEP1 and SMMC-7721 cells (Fig. 4C and D). However, the other downstream molecules related to inflammation of this pathway, such as CCL3, CCL5, CCL22, CSF-1, and transforming growth factor β (TGF-β), had no significant alteration (Fig. 4D). In addition, we validated that there were moderate correlation between CTSC and the downstream molecules (mentioned above) of TNF-α/p38 MAPK pathway in clinical specimens by the GEPIA. The results showed that MMP-3, MMP-9, vimentin, and TNF-α expression were positively correlated with CTSC (Fig. 4E).
Since higher expression of CTSC showed malignant properties in biological process of HCC and contributed to an unfavorable outcome, further exploration on the fundamental mechanism in which CTSC is involved may help to spot new therapeutic target for patients with HCC. Therefore, we attempted to analyze both the upstream and downstream players interacted with CTSC. We looked for the candidate TF regulating CTSC on GeneCards website. We found that C/EBPβ, the downstream of TNF-α/p38 MAPK pathway as indicated by KEGG inquiry [16], had frequent binding sites in the CTSC gene promoter. This binding potential of C/EBPβ to CTSC was further backed by Chip-Seq (GEO accession: GSM935493) in the Cistrome Data Browser. Therefore, we speculated that CTSC was positively regulated by TNF-α/p38 MAPK pathway.
It has been reported that TNF-α can enhance the proliferation, migration, and invasion of HCC [17-19]. To explore whether TNF-α could regulate CTSC expression, TNF-α with series concentrations was used to stimulate CTSC expression in SMMC7721 and SK-HEP-1 cells. As we expected, the expression of CTSC was increased in a TNF-α concentrationdependent manner (Fig. 4F). Moreover, ralimetinib, an oral p38 MAPK inhibitor, was capable of decreasing the expression of CTSC in a concentration-dependent manner (Fig. 4G) and reversed the TNF-α induced CTSC expression (Fig. 4H). Collectively, these results suggested a possible positive feedback loop between CTSC and TNF-α/p38 MAPK pathway.
Discussion
As a member of the papain superfamily, CTSC ubiquitously expresses in many tissues and versatilely functions in various biological process. Aberrant expression and malignant potential of CTSC have been reported in various solid tumors. In this study, we found that CTSC was upregulated in HCC and was negatively correlated with patients’ prognosis. Mechanistically, CTSC increased the proliferative and metastatic potential of HCC cells through activating TNF-α/p38 MAPK pathway. Further, CTSC may interact with TNF-α/p38 MAPK signaling in a positive feedback manner. Elevated CTSC mRNA expression in HCC was showed in the GEPIA database that included 369 patients. Patients with high CTSC expression had shorter OS than those with low CTSC expression. We performed IHC for tissue microarrays containing 122 HCC patients who underwent curative liver resection in our center. Our results showed that high CTSC expression was associated with cirrhosis, ascites formation, and high serum AFP level. Survival analysis demonstrated that patients with high CTSC expression had poorer OS than those with low CTSC expression, which was consistent with the result from the GEPIA database. Therefore, CTSC may be a candidate marker to predict postsurgical OS of HCC patients.
CTSC is an emblematic member of the cysteine CTS proteases class, mediating physiological or pathological process in different ways [11]. Spatial specificity of CTSC has been reported [20]. In mammary tumorigenesis, CTSC was found to be not indispensable but essential in squamous carcinogenesis [11,20]. To explore the malignant biological role of CTSC in HCC, gain-of-function, and loss-of-function experiments were performed in vitro and in vivo. CTSC was found to promote proliferation, migration, and invasion in hepatocellular carcinogenesis. Previous studies revealed that CTSC could sustain stemness of glioma cells [21] and mediate autophagy in colorectal cancer cells [14]. However, our studies demonstrated that CTSC could not interfere with the stemness of HCC cells by modulating CD133 expression. And also, CTSC could not mediate autophagy through regulation of LC3 and p62 (data not shown).
To further illustrate the underlying mechanisms mediated by CTSC in HCC, we performed GSEA to seek the pathways recruited by CTSC. Several candidate signaling pathways correlated with carcinogenesis was found (Fig. 4A). After detecting the involved key regulators’ expression, TNF-α/ MAPK (p38) pathway was identified indeed activated (Fig. 4B). MAPK (p38) pathway plays a crucial role in cell proliferation and metastasis, the inflammatory microenvironment in cancers [22-25]. In neurological diseases, CTSC was found to induce microglia M1 polarization and promote neuroinflammation via activation of protein kinase C/p38- MAPK/nuclear factor-κB pathway [26]. Our study showed no significant alteration upon the expression of crucial inflammatory cytokines for polarization of tumor-associated macrophage, such as CCL3, CCL5, CCL22, CSF-1, and TGF-β, were observed when CTSC was aberrantly expressed (Fig. 4D). However, our results showed that MMP-3, MMP-9, vimentin, and TNF-α, the downstream molecules of TNF-α/MAPK (p38) pathway and the key mediators for cell proliferation, migration, and invasion, were upregulated when CTSC was overexpressed (Fig. 4C and D). These suggested that CTSC/MAPK (p38) axis might work differently and demonstrated the spatial heterogeneity of CTSC in HCC.
Through bioinformatic analysis, we found C/EBPβ was the candidate transcriptional factor of CTSC. Of note, C/ EBPβ has been reported as the downstream player of TNF-α/MAPK (p38) signaling [16]. Thus, it is reasonable that CTSC could be reciprocally regulated by TNF-α/MAPK (p38) signaling. As we expected, TNF-α could upregulated CTSC expression in concentration-dependent manner (Fig. 4F). This process could be inhibited by Ralimetinib, a MAPK (p38) inhibitor, in concentration-dependent manner (Fig. 4G). Furthermore, ralimetinib could reverse the upregulated action on CTSC by TNF-α (Fig. 4H). Therefore, there would be a positive feedback loop between CTSC and TNF-α/ MAPK (p38) signaling, thereby sustained the process of proliferation and metastasis of HCC cells.
MAPK (p38) inhibitor has been demonstrated antitumor effect on cervical, gastric and colon cancer [27-29]. Ralimetinib, an oral MAPK (p38) inhibitor, was currently performed first-in-human phase I pharmaceutical clinical trial in advanced cancers [30]. Given that the evidence that CTSC and TNF-α/MAPK (p38) pathway positive feedback loop contributed to inducing HCC cells proliferation, migration and invasion, and Ralimetinib could down-regulate CTSC expression in a concentration-dependent manner, we believed that Ralimetinib would be an effective targeting drug for HCC. CTSC expression profile would be helpful for the prediction of precise medication of Ralimetinib. This warrants further investigation.
Taken together, our study indicated that CTSC was high expression in nearly half of HCC patients. High CTSC expression would be a predictor for poor prognosis. Mechanistically, CTSC promoted HCC growth and metastasis through activated TNF-α/MAPK (p38) axis. Furthermore, a positive feedback loop between CTSC and TNF-α/MAPK (p38) pathway were identified. CTSC might be a candidate marker for prediction of precise medication of Ralimetinib, an oral MAPK (p38) inhibitor, for HCC.