1The Korea Central Cancer Registry, National Cancer Center, Goyang, Korea
2National Cancer Control Institute, National Cancer Center, Goyang, Korea
Correspondence: Young-Joo Won, PhD The Korea Central Cancer Registry, National Cancer Center, 323 Ilsan-ro, Ilsandong-gu, Goyang 410-769, Korea Tel: 82-31-920-2015 Fax: 82-31-920-2179 E-mail: astra67@ncc.re.kr
Received February 17, 2015 Accepted February 22, 2015
This is an Open-Access article distributed under the terms of the Creative Commons Attribution Non-Commercial License (http://creativecommons.org/licenses/by-nc/3.0/)
which permits unrestricted non-commercial use, distribution, and reproduction in any medium, provided the original work is properly cited.
Abstract
Purpose
The aim of this study was to report nationwide cancer statistics in Korea, including incidence, mortality, survival, and prevalence, and their trends.
Materials and Methods
Incidence data from 1993 to 2012 were obtained from the Korea National Cancer Incidence Database, and vital status was followed through December 31, 2013. Mortality data from 1983 to 2012 were obtained from Statistics Korea. Crude and age-standardized rates for incidence, mortality, and prevalence, and relative survival were calculated.
Results
A total of 224,177 cancer cases and 73,759 cancer deaths were reported in 2012, and there were 1,234,879 prevalent cases identified in Korea as of January 1, 2013. Over the past 14 years (1999-2012), overall incidence rates have increased by 3.3% per year. The incidence rates of liver and cervical cancers have decreased, while those of thyroid, breast, prostate, and colorectal cancers have increased. Notably, incidence of thyroid cancer increased by 22.3% per year in both sexes and has been the most common cancer since 2009. The mortality for all cancers combined decreased by 2.7% per year from 2002 to 2012. Five-year relative survival rates of patients diagnosed in the last 5 years (2008-2012) have improved by 26.9% compared with those from 1993 to1995.
Conclusion
Overall cancer mortality rates have declined since 2002 in Korea, while incidence has increased and survival has improved.
Cancer has been the leading cause of death in Korea since 1983 [1] and is the most burdensome disease [2]. More than 210,000 new cancer cases are diagnosed in Korea each year, and cancer is responsible for one in four deaths [3]. This article reports the most recent nationwide cancer statistics in Korea, including incidence, mortality, survival, prevalence, and their trends.
1. Data sources
The Ministry of Health and Welfare, Korea, initiated a nationwide hospital-based cancer registry called the Korea Central Cancer Registry (KCCR) in 1980. The registry collected 80%-90% of cancer cases annually from more than 180 training hospitals throughout the country.
In 1999, the KCCR expanded cancer registration to cover the entire population under the Population-Based Regional Cancer Registry Program. Details of the history, objectives, and activities of the KCCR have been documented elsewhere [4]. Incidence data for 1999-2012 were obtained from the Korea National Cancer Incidence Database (KNCI DB). The completeness of incidence data for 2012 was 97.7%, as determined by the Ajiki method [5].
Cancer cases were classified according to the International Classification of Diseases for Oncology, third edition [6] and converted according to the International Classification of Diseases, 10th edition (ICD-10) [7]. A total of 2,405,894 cancer cases first diagnosed between 1993 and 2012 from the KNCI DB were used in the survival analysis, and vital status was followed until December 31, 2013.
Mortality data from 1983 to 2012 were obtained from Statistics Korea [1]. Cause of death was coded and classified according to ICD-10 [7]. Population data were also obtained from Statistics Korea using the resident registration population on July 1 of specified years.
2. Analysis
Crude rates (CRs) and age-specific rates of cancer incidence and mortality were calculated. Age-standardized rates (ASRs) were calculated using Segi’s world standard population [8]. Cumulative risks of cancer, which represent the probability of developing cancer during one’s lifetime, were also calculated. Changes in the annual ASRs of cancer incidence were examined by calculating the annual percentage change over a time period as (exp(b)–1)×100, where b is the slope of the regression of log ASR for a given calendar year [9].
Prevalence was also calculated for assessment of cancer burden, which includes new and pre-existing cancer patients diagnosed during a given time period who were still alive on an index date. Using the cancer incidence database data from 1999 to 2012, we defined prevalent cases as patients who were diagnosed between January 1, 1999 and December 31, 2012, and were still alive on January 1, 2013. We calculated limited-duration prevalences, namely, 1- and 5-year prevalences. For example, the 5-year prevalence was calculated as the number of people alive on January 1, 2013 who had been diagnosed with cancer within the previous 5 years. We applied this counting method using the SEER*Stat software [10] to calculate the number of cases while adjusting for patients lost to follow-up.
The survival duration for each case was determined as the interval between the date of initial diagnosis and the date of death, date of loss to follow-up, or closing date for followup. Observed survival rates were calculated using the lifetable method and relative survival rates using the Ederer II method [11] were based on an algorithm written in SAS by Paul Dickman [12], with some minor modifications.
Selected Findings
1. Incidence
The overall number of incident cancer cases, deaths, and prevalent cases by sex and cancer site for 2012 in Korea are shown in Table 1. A total of 224,177 incident cancer cases and 73,759 deaths were reported to occur in 2012. As of January 1, 2013, 1,234,879 prevalent cancer cases diagnosed between 1999 and 2012 were identified. The cumulative risk of developing cancer during one’s lifetime in 2012 was 37.5% for males and 34.9% for females.
The cancer incidence rates in 2012 by sex and cancer site are shown in Table 2. The 2012 CRs per 100,000 of all sites combined were 446.2 and 444.4 for males and females, respectively. The ASRs per 100,000 of all sites combined were 326.4 and 290.1 for males and females, respectively. In males, the five leading primary cancer sites were stomach (CR, 82.7; ASR, 59.3), colon and rectum (CR, 69.3; ASR, 50.0), lung (CR, 61.0; ASR, 44.3), liver (CR, 48.2; ASR, 34.3), and prostate (CR, 36.8; ASR, 27.0), which together accounted for 66.8% of all newly diagnosed cancers in 2012. In females, the most common cancer site was thyroid (CR, 142.9; ASR, 102.4), followed by breast (CR, 65.7; ASR, 44.7), colon and rectum (CR, 45.9; ASR, 26.8), stomach (CR, 39.8; ASR, 23.5), and lung (CR, 26.8; ASR, 14.9), which together accounted for 72.3% of all newly diagnosed cancers. Thyroid cancer alone accounted for 32.2% of incident cases (n=35,955) among females in 2012.
2. Mortality
A total of 73,759 cancer deaths were reported in Korea for 2012, accounting for 27.6% of all deaths (Table 3). In 2012, the CRs per 100,000 for all sites combined were 184.5 and 108.5 in males and females, respectively. The ASRs per 100,000 for all sites combined were 135.2 and 57.7 for males and females, respectively. Cancers of the lung, liver, stomach, and colon/rectum were the main causes of cancer death, together accounting for approximately 61.6% of all cancer deaths in 2012 (Table 4).
In males, the five most common sites of cancer death in 2012 were lung (CR, 48.3; ASR, 35.1), liver (CR, 33.7; ASR, 24.1), stomach (CR, 24.2; ASR, 17.6), colon and rectum (CR, 18.5; ASR, 13.7), and pancreas (CR, 10.4; ASR, 7.6). In women, lung cancer (CR, 17.8; ASR, 8.9) was the leading cause of cancer death in 2012, followed by colon and rectum (CR, 13.8; ASR, 6.8), stomach (CR, 12.9; ASR, 6.5), liver (CR, 11.3; ASR, 6.1), and pancreas (CR, 8.6; ASR, 4.4).
3. Trends in cancer incidence
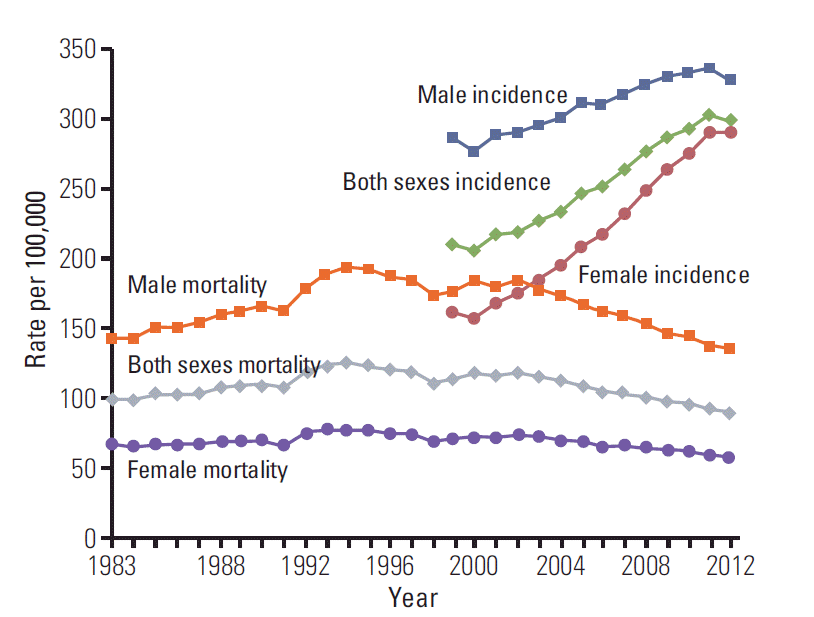
The cancer incidence rates from 1999 to 2012 in Korea for all sites combined and for selected sites are shown in Tables 5-7. The incidence for all sites combined increased by 3.3% per year (1.5% in males, 5.3% in females) from 1999 to 2012. The increase in cancer incidence is also illustrated in Fig. 1.
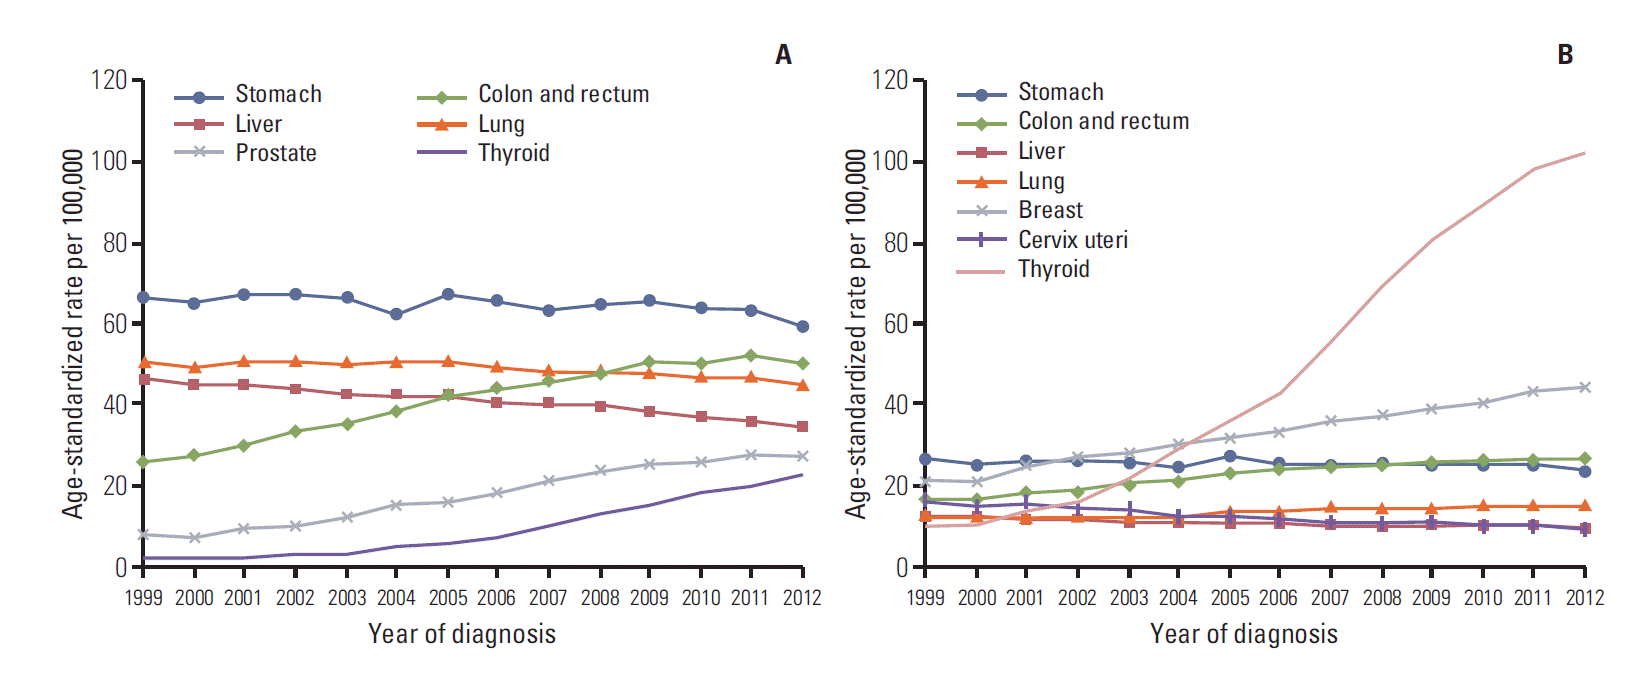
The incidence rates for colorectal and thyroid cancers have continued to increase in both sexes, as have those for prostate cancer in males and breast cancer in females (Fig. 2). In contrast, the incidences of liver cancer in both sexes, lung cancer in males, and cervical cancer in females have decreased. Notably, thyroid cancer increased rapidly, by 22.3% per year in both sexes, and has been the most common cancer since 2009. Improvements in the sensitivity of diagnostic techniques for thyroid cancer, such as the advent of ultrasound and fine-needle aspiration, have enabled detection of small-sized thyroid cancers, and screening rates have increased. Therefore, the increased incidence of thyroid cancer might reflect the identification of previously undetected diseases rather than a true increase in the occurrence of thyroid cancer [13-16]. In addition, due to the construction of a 1999-2012 KNCI DB, the completeness of the Korean cancer registry data has shown gradual improvement, and this may have contributed, in part, to the gradual overall increases in cancer incidence, particularly among elderly patients.
The incidence of some cancer sites in 2012, including stomach, colon and rectum, decreased compared to 2011. However, these trends could be causes of random error, therefore, these results should be interpreted with caution.
4. Age-specific incidence rates
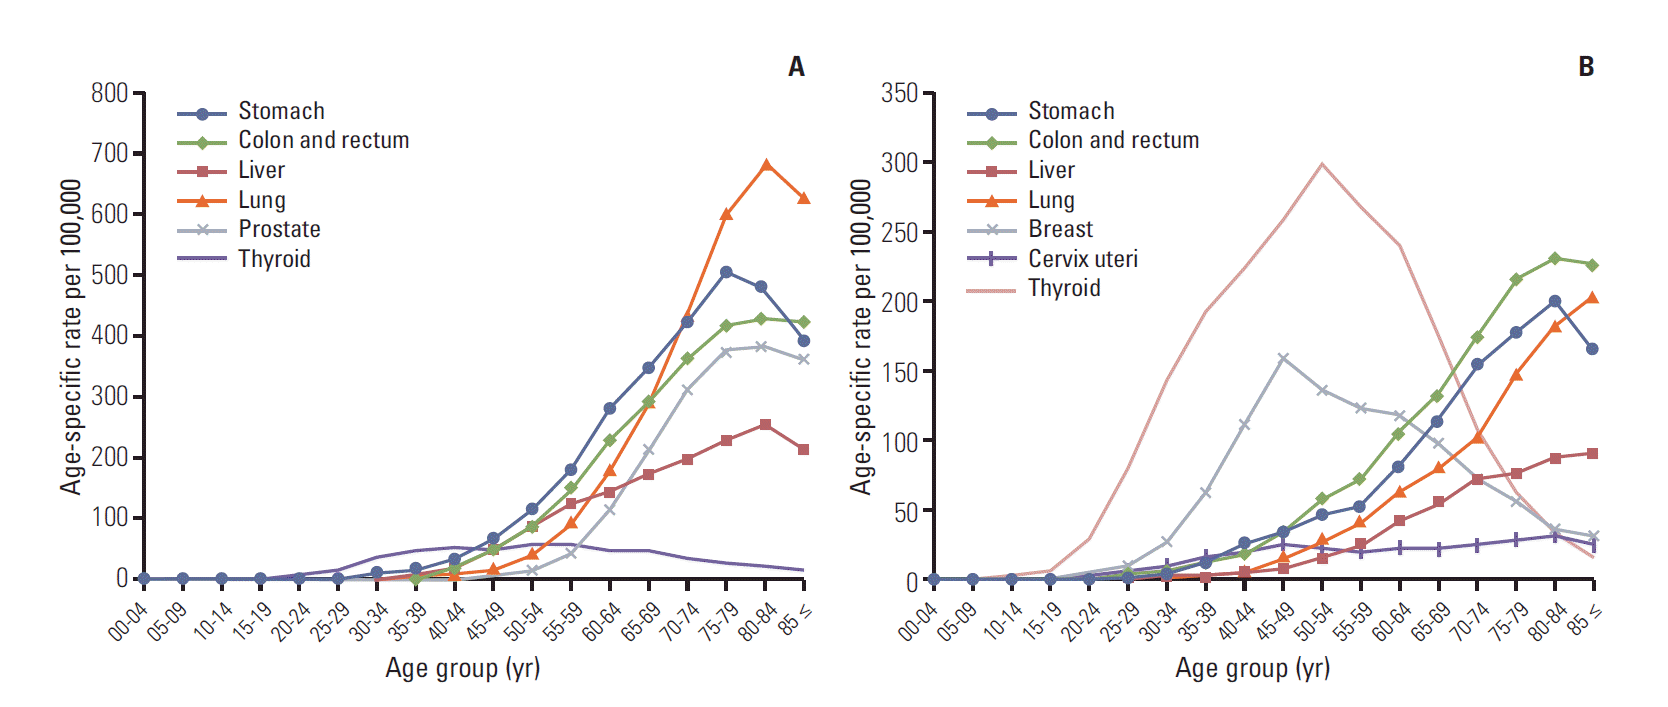
The most common cancer sites by sex and age group in 2012 are shown in Table 8. Leukemia and thyroid cancer were the most common cancer in both sexes in patients aged 0-14 and 15-34 years, respectively. For males, stomach cancer was the most common cancer in those aged 35-64, while lung cancer was more frequent among patients aged 65 and over. Thyroid cancer was the most common cancer in females aged 35-64 years, and colorectal cancer was the most common cancer among older females aged 65 and over.
The age-specific incidence rates for selected cancers in males and females in 2012 are shown in Fig. 3. The graphs show that the incidences of stomach, lung, liver, and colorectal cancers increased gradually with age. Incidences of breast and thyroid cancers in females were highest among patients in their late 40s and early 50s, respectively, and leveled off thereafter. The age-specific pattern of breast cancer is different from those in Western countries [17].
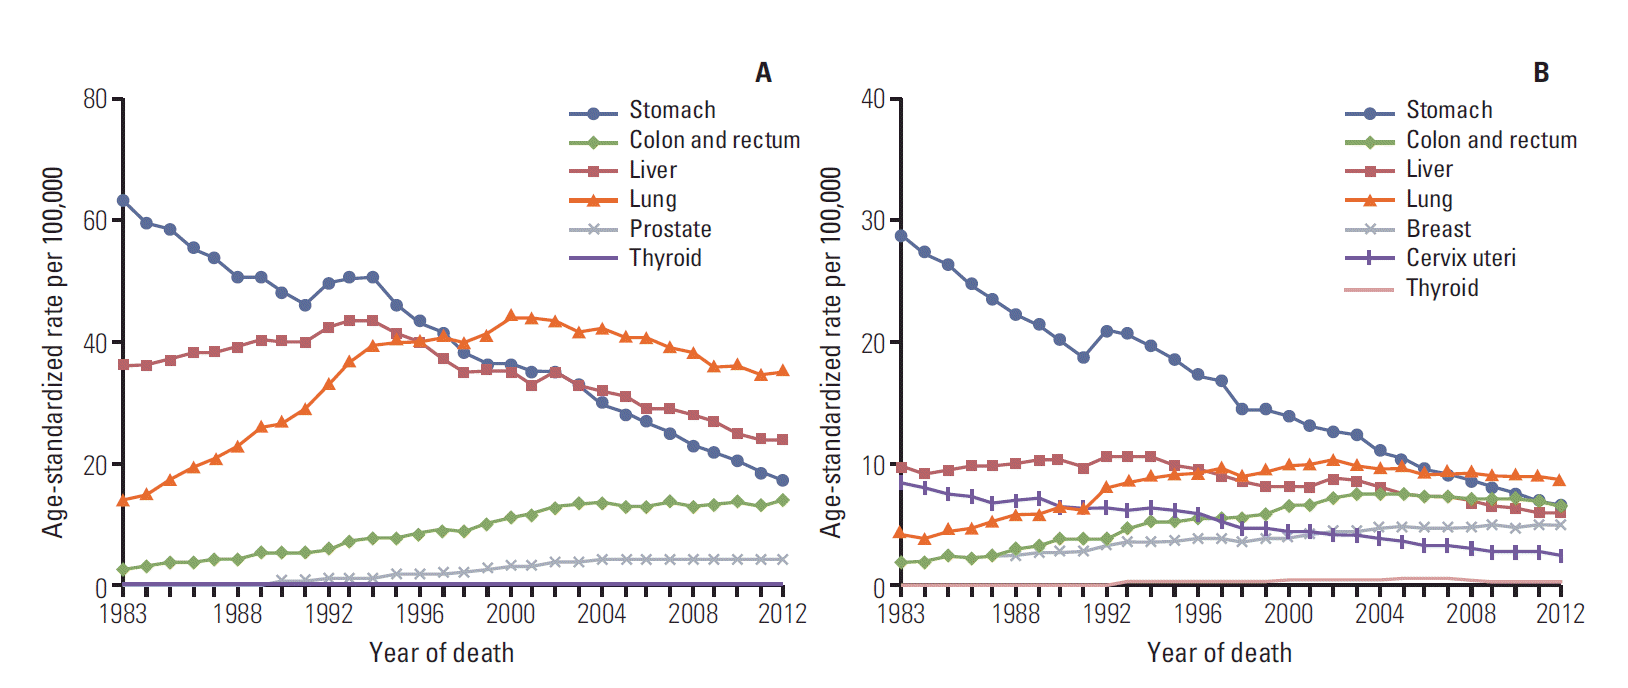
5. Trends in cancer mortality
The trends in cancer deaths for all sites combined and for selected sites are shown in Figs. 1 and 4. ASRs of mortality for all sites combined decreased by 2.7% per year in both sexes since 2002. Lung cancer surpassed stomach cancer as the leading cause of cancer death in 1999 and is expected to account for 22.6% of all cancer deaths in 2012. However, the ASRs of mortality due to lung cancer have decreased slightly in both males and females since 2002. The ASRs of mortality due to stomach and cervical cancers have also shown a continuous decrease. Along with significant increases in prostate and female breast cancer incidence rates, mortality rates of these cancers have also continued to increase.
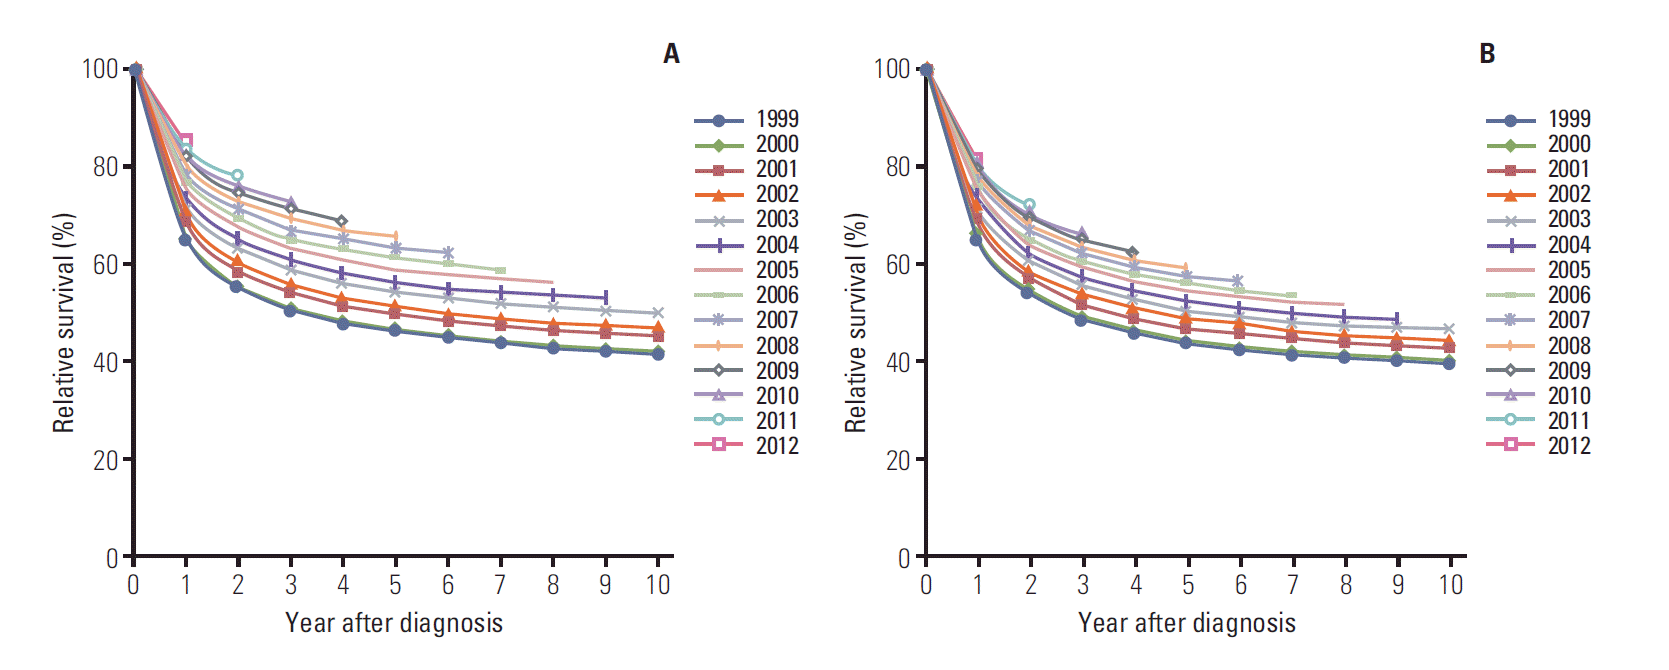
6. Survival rates
The trends in relative survival for all sites combined among both sexes by year of diagnosis from 1999 to 2012 are shown in Fig. 5. The relative survival for all sites combined increased with year of diagnosis, and also increased when we excluded thyroid cancer cases in our analysis.
Table 9 shows the 5-year relative survival rates for four diagnosis periods: 1993-1995, 1996-2000, 2001-2005, and 2008-2012. The 5-year relative survival rate of patients diagnosed with cancer in the most recent period (2008-2012) was 68.1% for all sites combined in both sexes (59.6% in males and 76.6% in females). When compared with earlier periods, notable improvements in the 5-year relative survival rates were observed for all sites combined. The higher cancer survival rate in females might be explained in part by cancers common in females (e.g., thyroid and breast cancers) having relatively good prognoses.
When examined by year of diagnosis and cancer site, the 5-year relative survival rates appeared to be higher for most major cancers in patients diagnosed from 2008 to 2012 compared with those diagnosed from 1993 to 1995, with the exception of pancreatic cancer. The greatest improvements were seen in cancers of the prostate, stomach, leukemia, lip/oral cavity/pharynx, and non-Hodgkin lymphoma. The improving survival rates could be attributable to early detection and improved treatments [18,19]; however, this requires further evaluation. Only pancreatic cancer showed no improvement in 5-year relative survival rate compared with 1993-1995. A lack of progress in early detection and treatment could explain the observed absence of improvement in the survival rate for pancreatic cancer [20].
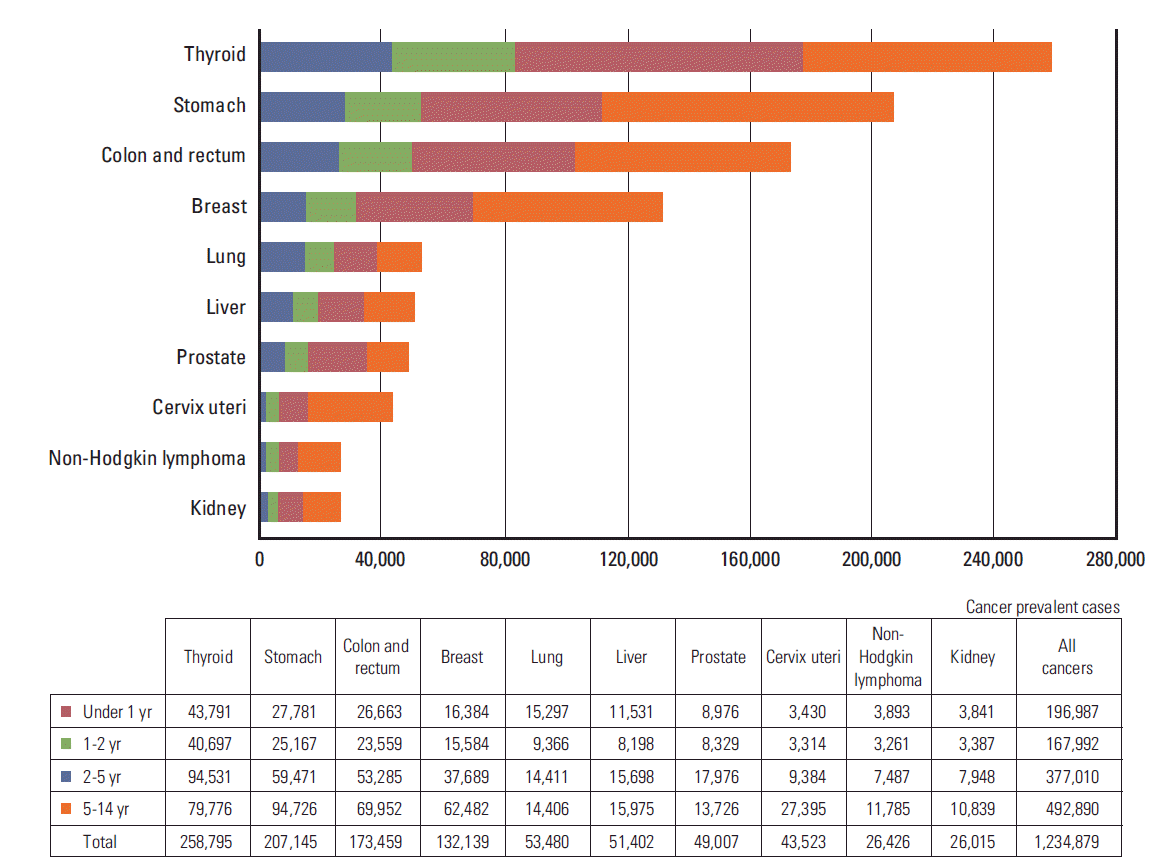
7. Prevalence rates
The cancer prevalence rates by sex and cancer site on January 1, 2013 in Korea are shown in Table 10. The CRs per 100,000 of cancer prevalence for all sites combined were 2,175.0 and 2,730.9 in males and females, respectively, and the ASRs per 100,000 of cancer prevalence for all sites combined were 1,592.2 and 1,788.0 in males and females, respectively. In males, the five leading primary sites of cancer for prevalence were stomach (CR, 546.5; ASR, 391.3), colon and rectum (CR, 410.9; ASR, 296.6), prostate (CR, 194.6; ASR, 141.6), thyroid (CR, 162.5; ASR, 114.8), and liver (CR, 152.6; ASR, 109.7), which together accounted for 67.4% of all prevalent cancer cases. In females, the most common cancer site was thyroid (CR, 866.0; ASR, 600.7), followed by breast (CR, 523.0; ASR, 346.7), colon and rectum (CR, 278.1; ASR, 161.8), stomach (CR, 276.2; ASR, 162.9), and cervix uteri (CR, 173.0; ASR, 111.7), which together accounted for 77.5% of all prevalent cancer cases.
The prevalence by time since diagnosis is shown in Fig. 6. For all cancers combined, the 2-year prevalence constituted 29.6% of all prevalent cases. The 2-year prevalence, as a percentage of the total prevalence, was highest for thyroid (23.1%), followed by stomach (14.5%) and colon and rectum (13.8%), which had high incidence rates and good prognoses. For all cancers combined in both sexes, the 2-5-year and > 5-year prevalences accounted for 30.5% and 39.9% of the total prevalence, respectively. The long-term prevalences for lung and liver cancers were relatively low due to low survival rates of lung and liver cancer patients.
Conflicts of Interest
Conflict of interest relevant to this article was not reported.
Acknowledgments
This work was supported by a research grant from the National Cancer Center (No. 1310220), Republic of Korea. The authors are indebted to Korea Central Cancer Registry (KCCR)-affiliated hospitals, non-KCCR-affiliated hospitals, 11 regional cancer registries (the Busan, Daegu and Gyeongbuk, Gwangju and Jeonnam, Incheon, Daejeon, Ulsan, Gangwon, Chungbuk, Jeonbuk, Gyeongnam and Jejudo cancer registries), the National Health Insurance Service and Statistics Korea for data collection.
Fig. 1.
Annual age-standardized cancer incidence and death rates by sex for all sites from 1983 to 2012 in Korea. Age standardization was based on the world standard population.
Fig. 2.
Trends in age-standardized incidences of selected cancers by sex from 1999 to 2012 in Korea. Age standardization was based on the world standard population. (A) Male. (B) Female.
Fig. 3.
Age-specific incidence rates of major cancers for 2012 in Korea. (A) Male. (B) Female.
Fig. 4.
Annual age-standardized cancer mortalities of selected cancers by sex from 1983 to 2012 in Korea. Age standardization was based on the world standard population. (A) Male. (B) Female.
Fig. 5.
Trends in relative survival by year of diagnosis from 1999 to 2012. (A) All sites for both sexes. (B) All sites except thyroid cancer for both sexes.
Fig. 6.
Prevalence of major cancer sites by time since diagnosis on January 1, 2013 in Korea.
Table 1.
Cancer incidence, prevalence, and deaths by sex in Korea, 2012
a) Limited-duration prevalent cases on January 1, 2013; These patients who were diagnosed between January 1, 1999 and December 31, 2012 and were alive on January 1, 2013; Multiple primary cancer cases were counted multiple times,
b) Includes the gallbladder and other/unspecified parts of the biliary tract.
Table 2.
Crude and age-standardized cancer incidence rates by sex in Korea, 2012
APC, annual percentage change; CNS, central nervous system. APC was calculated using age-standardized incidence data based on the world standard population.
a) Significantly different from zero (p < 0.05),
b) Includes the gallbladder and other/unspecified parts of the biliary tract.
Table 6.
Trends in cancer incidence rates in males from 1999 to 2012 in Korea
APC, annual percentage change; CNS, central nervous system. APC was calculated using age-standardized incidence data based on the world standard population.
a) Significantly different from zero (p < 0.05),
b) Includes the gallbladder and other/unspecified parts of the biliary tract.
Table 7.
Trends in cancer incidence rates in females from 1999 to 2012 in Korea
APC, annual percentage change; CNS, central nervous system. APC was calculated using age-standardized incidence data based on the world standard population.
a) Significantly different from zero (p < 0.05),
b) Includes the gallbladder and other/unspecified parts of the biliary tract.
Table 8.
The five major sites of cancer incidence by age group and sex in Korea, 2012
a) Crude prevalence rate: number of prevalent cases divided by the corresponding person-years of observation; Prevalent cases were defined as patients who were diagnosed between January 1, 1999 and December 31, 2012 and who were alive on January 1, 2013; Multiple primary cancer cases were counted multiple times,
b) Age-adjusted using the world standard population,
c) Includes the gallbladder and other/unspecified parts of the biliary tract.
References
1. Statistics Korea [Internet]. Daejeon: Statistics Korea; 2014. [cited 2014 Jan 4]. Available from: http://kosis.kr
2. Yoon SJ, Bae SC, Lee SI, Chang H, Jo HS, Sung JH, et al. Measuring the burden of disease in Korea. J Korean Med Sci. 2007;22:518–23.
3. Jung KW, Won YJ, Kong HJ, Oh CM, Lee DH, Lee JS. Cancer statistics in Korea: incidence, mortality, survival, and prevalence in 2011. Cancer Res Treat. 2014;46:109–23.
4. Shin HR, Won YJ, Jung KW, Kong HJ, Yim SH, Lee JK, et al. Nationwide cancer incidence in Korea, 1999~2001; first result using the national cancer incidence database. Cancer Res Treat. 2005;37:325–31.
5. Ajiki W, Tsukuma H, Oshima A. Index for evaluating completeness of registration in population-based cancer registries and estimation of registration rate at the Osaka Cancer Registry between 1966 and 1992 using this index. Nihon Koshu Eisei Zasshi. 1998;45:1011–7.
6. Fritz A, Percy C, Jack A, Shanmugaratnam K, Sobin L, Parkin DM, et al. International classification of diseases for oncology. 3rd edGeneva: World Health Organization; 2000.
7. World Health Organization. International statistical classification of diseases and related health problems. 10th revGeneva: World Health Organization; 1994.
8. Segi M. Cancer mortality for selected sites in 24 countries (1950-1957). Sendai: Tohoku University School of Medicine; 1960.
9. Howlader N, Noone A, Krapcho M, Garshell J, Neyman N, Altekruse SF, et al. SEER cancer statistics review, 1975-2010. Bethesda, MD: National Cancer Institute; 2013.
10. National Cancer Institute. SEER*Stat Program, version 6.6.1 [Internet]. Bethesda, MD: National Cancer Institute; 2013. [cited 2013 Jan 4]. Available from: http://seer.cancer.gov/seerstat/
11. Ederer F, Heise H. Instructions to IBM 650 programmers in processing survival computations. Methodological note. No. 10Bethesda, MD: National Cancer Institute; 1959.
12. Paul Dickman [Internet]. Stockholm: PaulDickman.com; 2014. [cited 2014 Jan 14]. Available from: http//www.pauldickman.com
13. Davies L, Welch HG. Increasing incidence of thyroid cancer in the United States, 1973-2002. JAMA. 2006;295:2164–7.
14. Enewold L, Zhu K, Ron E, Marrogi AJ, Stojadinovic A, Peoples GE, et al. Rising thyroid cancer incidence in the United States by demographic and tumor characteristics, 1980-2005. Cancer Epidemiol Biomarkers Prev. 2009;18:784–91.
15. Han MA, Choi KS, Lee HY, Kim Y, Jun JK, Park EC. Current status of thyroid cancer screening in Korea: results from a nationwide interview survey. Asian Pac J Cancer Prev. 2011;12:1657–63.
16. Kim SY. Study to provide evidence of health screening service for thyroid cancer. Seoul: National Evidence-based Healthcare Collaborating Agency; 2012.
17. Forman D, Bray F, Brewster DH, Gombe Mbalawa C, Kohler B, Pineros M, et al. Cancer incidence in five continents. Vol.10 (electronic version). VolLyon: IARC Press; 2013.
18. Jung KW, Yim SH, Kong HJ, Hwang SY, Won YJ, Lee JK, et al. Cancer survival in Korea 1993-2002: a population-based study. J Korean Med Sci. 2007;22 Suppl:S5–10.
19. Gondos A, Bray F, Hakulinen T, Brenner H; EUNICE Survival Working Group. Trends in cancer survival in 11 European populations from 1990 to 2009: a model-based analysis. Ann Oncol. 2009;20:564–73.
20. Dickman PW, Adami HO. Interpreting trends in cancer patient survival. J Intern Med. 2006;260:103–17.